L
Seller's Agent in 2017
Lorraine Wiley
Coldwell Banker Realty
Estimated Value: $342,000 - $443,000
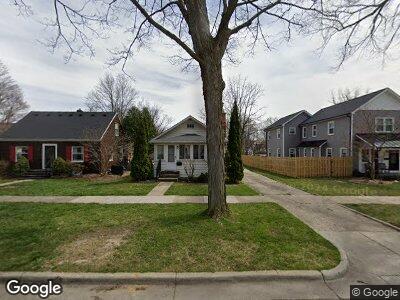
Located in a quiet neighborhood 1 block from Allmendinger Park and 2 blocks west of UM Stadium, this lovely furnished bungalow has 2 bedrooms (1 currently used as an office), living room, dining room, kitchen, lovely 3 season enclosed porch, laundry in basement. Landlord provides trash pickup, yard maintenance and snow removal (driveway and city sidewalk only). $250 non-refundable cleaning fee. No Smoking. No pets. No exceptions. Please do not ask.
| Date | Buyer | Sale Price | Title Company |
|---|---|---|---|
| Chung Sonya S | -- | None Available | |
| Chung Susan S | -- | -- | |
| Chung Susan S | -- | -- | |
| Chung Susan S | -- | -- | |
| Chung Susan S Trust | -- | -- |
| Date | Status | Borrower | Loan Amount |
|---|---|---|---|
| Closed | Chung Susan S | $0 |
| Date | Event | Price | Change | Sq Ft Price |
|---|---|---|---|---|
| 08/07/2017 08/07/17 | Rented | $1,400 | +1.8% | -- |
| 08/07/2017 08/07/17 | Under Contract | -- | -- | -- |
| 06/26/2017 06/26/17 | For Rent | $1,375 | 0.0% | -- |
| 06/09/2016 06/09/16 | Rented | $1,375 | 0.0% | -- |
| 05/12/2016 05/12/16 | Under Contract | -- | -- | -- |
| 04/15/2016 04/15/16 | For Rent | $1,375 | 0.0% | -- |
| 06/01/2015 06/01/15 | Rented | $1,375 | -1.8% | -- |
| 04/17/2015 04/17/15 | Under Contract | -- | -- | -- |
| 11/01/2014 11/01/14 | For Rent | $1,400 | -- | -- |
| Year | Tax Paid | Tax Assessment Tax Assessment Total Assessment is a certain percentage of the fair market value that is determined by local assessors to be the total taxable value of land and additions on the property. | Land | Improvement |
|---|---|---|---|---|
| 2024 | $7,237 | $155,000 | $0 | $0 |
| 2023 | $6,683 | $155,900 | $0 | $0 |
| 2022 | $8,088 | $148,100 | $0 | $0 |
| 2021 | $7,860 | $145,500 | $0 | $0 |
| 2020 | $7,612 | $146,000 | $0 | $0 |
| 2019 | $7,261 | $136,800 | $136,800 | $0 |
| 2018 | $7,124 | $131,900 | $0 | $0 |
| 2017 | $6,872 | $109,200 | $0 | $0 |
| 2016 | $3,410 | $69,009 | $0 | $0 |
| 2015 | $3,171 | $68,803 | $0 | $0 |
| 2014 | $3,171 | $66,654 | $0 | $0 |
| 2013 | -- | $66,654 | $0 | $0 |
L
Seller's Agent in 2017
Lorraine Wiley
Coldwell Banker Realty
S
Seller Co-Listing Agent in 2017
Sarah Olsen
Coldwell Banker Professionals