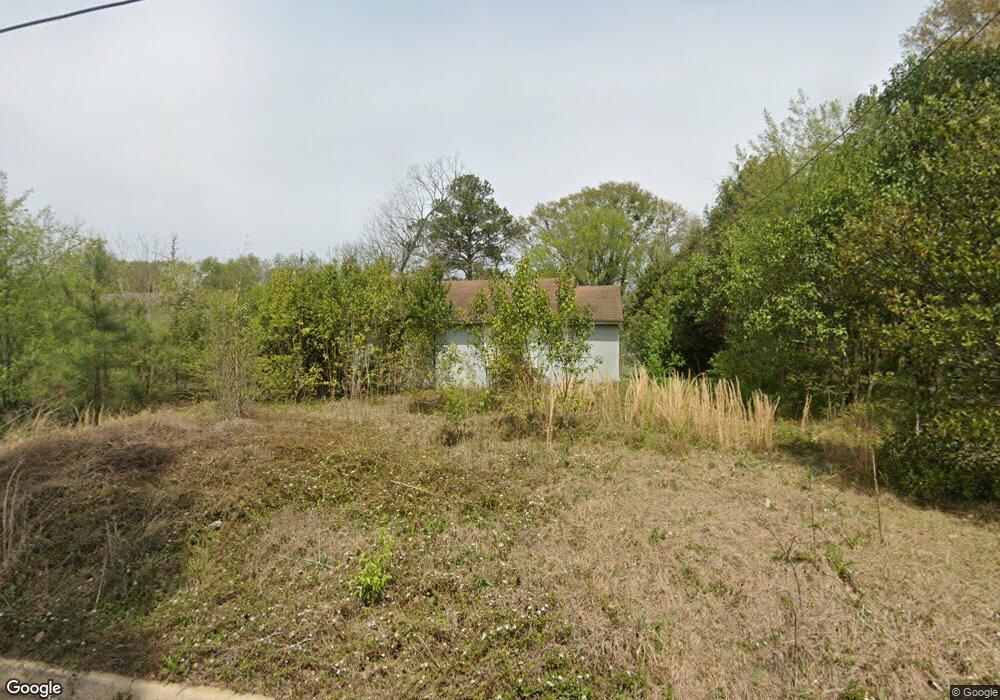
1211 Hillridge Dr Macon, GA 31206
Estimated Value: $35,278 - $81,000
2
Beds
1
Bath
777
Sq Ft
$65/Sq Ft
Est. Value
About This Home
This home is located at 1211 Hillridge Dr, Macon, GA 31206 and is currently estimated at $50,320, approximately $64 per square foot. 1211 Hillridge Dr is a home located in Bibb County with nearby schools including Bruce Elementary School, Rutland Middle School, and Rutland High School.
Ownership History
Date
Name
Owned For
Owner Type
Purchase Details
Closed on
Aug 15, 2022
Sold by
Mre Enterprises Llc
Bought by
Blackman Realty Company Llc
Current Estimated Value
Purchase Details
Closed on
Aug 5, 2022
Sold by
Mendez Sawyer
Bought by
Marshall Diane
Purchase Details
Closed on
Sep 13, 2021
Sold by
Marshall Diane
Bought by
Mre Enterprises Llc
Purchase Details
Closed on
Feb 8, 2021
Sold by
Sawyer Mendez
Bought by
Marshall Diane
Purchase Details
Closed on
Nov 4, 2020
Sold by
Marshall Diane and Sawyer Mendez
Bought by
Buchanon Mary
Purchase Details
Closed on
May 6, 2013
Sold by
Bryant Frazier
Bought by
Mendez Sawyer
Purchase Details
Closed on
May 8, 2006
Sold by
Coleman Properties Inc
Bought by
Marshall Diane and Bryant Leeann
Purchase Details
Closed on
Feb 17, 2006
Sold by
Troutman Elizabeth and Troutman Thomas J
Bought by
Coleman Properties Inc
Create a Home Valuation Report for This Property
The Home Valuation Report is an in-depth analysis detailing your home's value as well as a comparison with similar homes in the area
Home Values in the Area
Average Home Value in this Area
Purchase History
| Date | Buyer | Sale Price | Title Company |
|---|---|---|---|
| Blackman Realty Company Llc | $16,000 | None Listed On Document | |
| Mre Enterprises Llc | -- | None Listed On Document | |
| Marshall Diane | -- | None Listed On Document | |
| Mre Enterprises Llc | -- | None Available | |
| Marshall Diane | -- | None Available | |
| Buchanon Mary | $2,500 | None Available | |
| Mendez Sawyer | -- | -- | |
| Marshall Diane | $33,000 | None Available | |
| Coleman Properties Inc | $10,000 | None Available |
Source: Public Records
Tax History Compared to Growth
Tax History
| Year | Tax Paid | Tax Assessment Tax Assessment Total Assessment is a certain percentage of the fair market value that is determined by local assessors to be the total taxable value of land and additions on the property. | Land | Improvement |
|---|---|---|---|---|
| 2025 | $135 | $5,497 | $2,800 | $2,697 |
| 2024 | $152 | $5,977 | $3,550 | $2,427 |
| 2023 | $177 | $5,977 | $3,550 | $2,427 |
| 2022 | $489 | $3,440 | $1,605 | $1,835 |
| 2021 | $38 | $1,000 | $371 | $629 |
| 2020 | $151 | $3,893 | $1,445 | $2,448 |
| 2019 | $152 | $3,893 | $1,445 | $2,448 |
| 2018 | $389 | $3,491 | $1,043 | $2,448 |
| 2017 | $131 | $3,505 | $1,043 | $2,462 |
| 2016 | $133 | $3,831 | $1,124 | $2,708 |
| 2015 | $188 | $3,831 | $1,124 | $2,708 |
| 2014 | $216 | $3,831 | $1,124 | $2,708 |
Source: Public Records
Map
Nearby Homes
- 1220 Hillridge Dr
- 1239 Hillridge Dr
- 1216 Buena Vista Ave
- 1170 Buena Vista Ave
- 1156 Triple Hill Dr
- 4142 Buena Vista Ave
- 1094 Triple Hill Dr
- 4154 Houston Ave
- 1322 Triple Hill Dr
- 4187 Buena Vista Ave
- 1325 Triple Hill Dr
- 4071 Marse Allen Rd
- 1040 Triple Hill Dr
- 935 Troupe St
- 4006 Emory Dr
- 1175 Hartley St
- 1189 Hartley St
- 1219 Hillridge Dr
- 4145 Pinson St
- 4137 Pinson St
- 1223 Hillridge Dr
- 4157 Pinson St
- 4131 Pinson St
- 1231 Hillridge Dr
- 1212 Hillridge Dr
- 1212 Hillridge Dr Unit B
- 1212 Hillridge Dr Unit A
- 4169 Pinson St
- 4123 Pinson St
- 1226 Hillridge Dr
- 1232 Hillridge Dr
- 1236 Rocky Creek Rd
- 4179 Pinson St
- 4162 Pinson St
- 1240 Hillridge Dr
- 4152 Pinson St
- 4115 Pinson St