Estimated Value: $113,000 - $166,000
Studio
1
Bath
1,074
Sq Ft
$128/Sq Ft
Est. Value
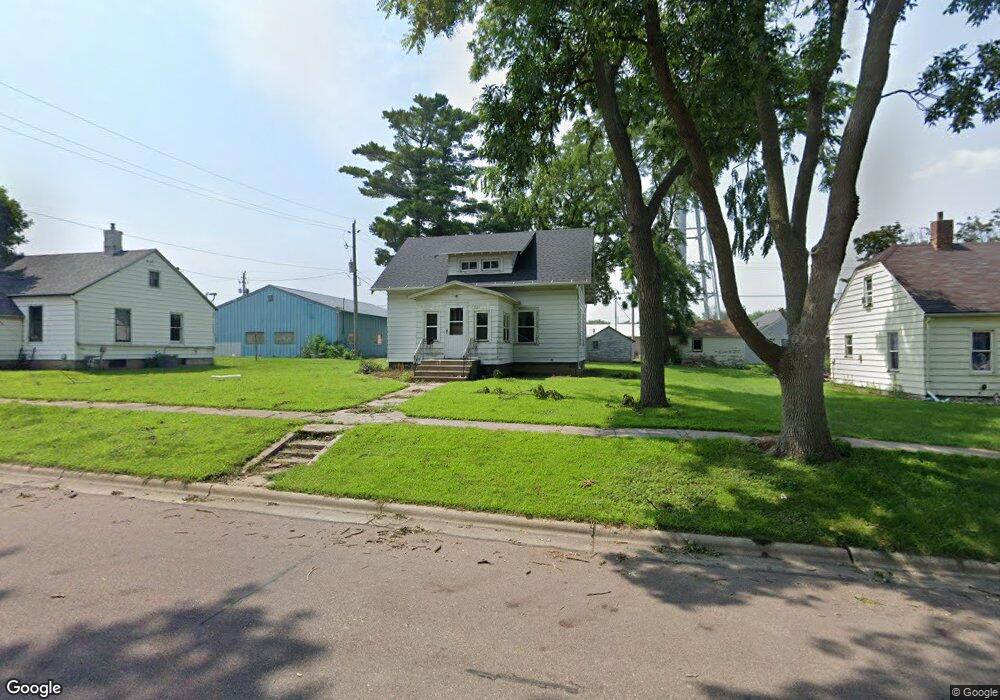
About This Home
This home is located at 1211 Maple St, Hull, IA 51239 and is currently estimated at $137,729, approximately $128 per square foot. 1211 Maple St is a home with nearby schools including Boyden-Hull Elementary School, Boyden-Hull High School, and Hull Christian School.
Ownership History
Date
Name
Owned For
Owner Type
Purchase Details
Closed on
Sep 15, 2022
Sold by
Dejong Zachary
Bought by
Haley Vanschepen
Current Estimated Value
Home Financials for this Owner
Home Financials are based on the most recent Mortgage that was taken out on this home.
Original Mortgage
$72,000
Interest Rate
6.7%
Mortgage Type
Construction
Purchase Details
Closed on
Apr 25, 2019
Sold by
Northwest Housing Llc
Bought by
Dejong Zachary
Home Financials for this Owner
Home Financials are based on the most recent Mortgage that was taken out on this home.
Original Mortgage
$7,000
Interest Rate
4%
Mortgage Type
Unknown
Create a Home Valuation Report for This Property
The Home Valuation Report is an in-depth analysis detailing your home's value as well as a comparison with similar homes in the area
Purchase History
| Date | Buyer | Sale Price | Title Company |
|---|---|---|---|
| Haley Vanschepen | $80,000 | -- | |
| Dejong Zachary | $70,000 | -- |
Source: Public Records
Mortgage History
| Date | Status | Borrower | Loan Amount |
|---|---|---|---|
| Previous Owner | Haley Vanschepen | $72,000 | |
| Previous Owner | Dejong Zachary | $7,000 | |
| Previous Owner | Dejong Zachary | $56,000 |
Source: Public Records
Tax History
| Year | Tax Paid | Tax Assessment Tax Assessment Total Assessment is a certain percentage of the fair market value that is determined by local assessors to be the total taxable value of land and additions on the property. | Land | Improvement |
|---|---|---|---|---|
| 2025 | $1,314 | $112,510 | $22,950 | $89,560 |
| 2024 | $1,314 | $96,720 | $22,950 | $73,770 |
| 2023 | $1,290 | $96,720 | $22,950 | $73,770 |
| 2022 | $1,464 | $84,310 | $22,950 | $61,360 |
| 2021 | $1,420 | $84,740 | $22,950 | $61,790 |
| 2020 | $1,420 | $78,120 | $22,950 | $55,170 |
| 2019 | $1,430 | $77,750 | $9,560 | $68,190 |
| 2018 | $1,460 | $77,750 | $9,560 | $68,190 |
| 2017 | $1,460 | $77,750 | $9,560 | $68,190 |
| 2014 | $1,250 | $67,310 | $0 | $0 |
Source: Public Records
Map
Nearby Homes
Your Personal Tour Guide
Ask me questions while you tour the home.