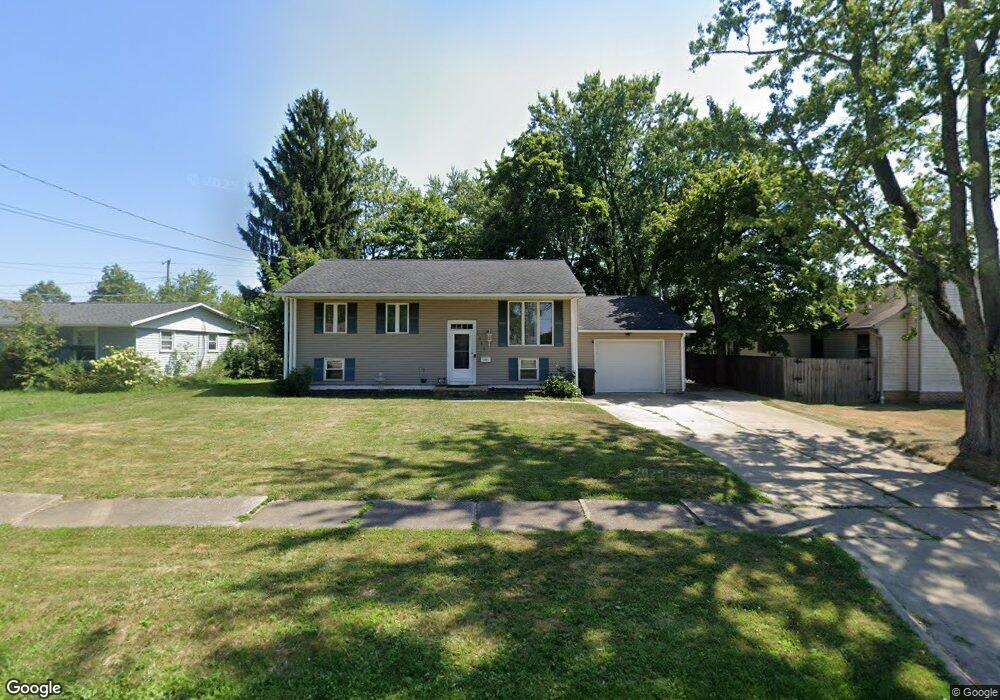
1211 Overlook Dr Ashland, OH 44805
Estimated Value: $199,000 - $254,000
3
Beds
1
Bath
1,836
Sq Ft
$122/Sq Ft
Est. Value
About This Home
This home is located at 1211 Overlook Dr, Ashland, OH 44805 and is currently estimated at $224,523, approximately $122 per square foot. 1211 Overlook Dr is a home located in Ashland County with nearby schools including Ashland High School, Ashland County Community Academy, and Ashland Christian Elementary School.
Ownership History
Date
Name
Owned For
Owner Type
Purchase Details
Closed on
Apr 29, 2015
Sold by
Brodie Zachary J and Brodie Nicole M
Bought by
Gregg Matthew A
Current Estimated Value
Home Financials for this Owner
Home Financials are based on the most recent Mortgage that was taken out on this home.
Original Mortgage
$110,953
Outstanding Balance
$85,691
Interest Rate
3.75%
Mortgage Type
FHA
Estimated Equity
$138,832
Purchase Details
Closed on
Oct 26, 2009
Sold by
Kudrin Karen C
Bought by
Brodie Zachary J and Brodie Nicole M
Purchase Details
Closed on
Apr 6, 2006
Sold by
Kudrin Stephen A
Bought by
Kudrin Karen C
Purchase Details
Closed on
Jun 30, 2004
Sold by
Adkins Edward B
Bought by
Kudrin Stephen A
Purchase Details
Closed on
Apr 29, 1999
Sold by
Johnson Mathew C
Bought by
Adkins Edward B
Purchase Details
Closed on
May 14, 1993
Bought by
Johnson Mathew C
Create a Home Valuation Report for This Property
The Home Valuation Report is an in-depth analysis detailing your home's value as well as a comparison with similar homes in the area
Home Values in the Area
Average Home Value in this Area
Purchase History
| Date | Buyer | Sale Price | Title Company |
|---|---|---|---|
| Gregg Matthew A | $113,000 | Ashland Title Agcy | |
| Brodie Zachary J | $115,000 | -- | |
| Kudrin Karen C | -- | -- | |
| Kudrin Stephen A | $117,000 | -- | |
| Adkins Edward B | $100,000 | -- | |
| Johnson Mathew C | $75,000 | -- |
Source: Public Records
Mortgage History
| Date | Status | Borrower | Loan Amount |
|---|---|---|---|
| Open | Gregg Matthew A | $110,953 |
Source: Public Records
Tax History Compared to Growth
Tax History
| Year | Tax Paid | Tax Assessment Tax Assessment Total Assessment is a certain percentage of the fair market value that is determined by local assessors to be the total taxable value of land and additions on the property. | Land | Improvement |
|---|---|---|---|---|
| 2024 | $1,785 | $51,680 | $10,790 | $40,890 |
| 2023 | $1,785 | $51,680 | $10,790 | $40,890 |
| 2022 | $1,634 | $37,450 | $7,820 | $29,630 |
| 2021 | $1,640 | $37,450 | $7,820 | $29,630 |
| 2020 | $1,553 | $37,450 | $7,820 | $29,630 |
| 2019 | $1,509 | $33,690 | $7,770 | $25,920 |
| 2018 | $1,523 | $33,690 | $7,770 | $25,920 |
| 2017 | $1,528 | $33,690 | $7,770 | $25,920 |
| 2016 | $1,451 | $30,620 | $7,060 | $23,560 |
| 2015 | $1,438 | $30,620 | $7,060 | $23,560 |
| 2013 | $1,609 | $33,730 | $7,040 | $26,690 |
Source: Public Records
Map
Nearby Homes
- 1136 Overlook Dr
- 178 Sharon Ave
- 821 Ohio St
- 702 Sandusky St
- 806 Wick Ave
- 300 Dorchester St
- 912 Berry Ave
- 1064 Elmarna Ave
- 410 Ohio St
- 323 W 4th St
- 325 W 4th St
- 427 W Main St
- 1140 Smith Rd
- 225 Prospect St
- 218 Prospect St
- 1026 Claremont Ave
- 1537 Short St
- 1115 Cottage St
- 219 W Washington St
- 421 Center St
- 321 Fairview Dr
- 1157 Overlook Dr
- 1210 Winthrop Ln
- 309 Fairview Dr
- 1210 Overlook Dr
- 1149 Overlook Dr
- 1156 Winthrop Ln
- 1202 Overlook Dr
- 343 Fairview Dr
- 1148 Winthrop Ln
- 324 Fairview Dr
- 316 Fairview Dr
- 1148 Overlook Dr
- 308 Fairview Dr
- 1143 Overlook Dr
- 340 Fairview Dr
- 359 Fairview Dr
- 300 Fairview Dr
- 1140 Winthrop Ln
- 1142 Overlook Dr