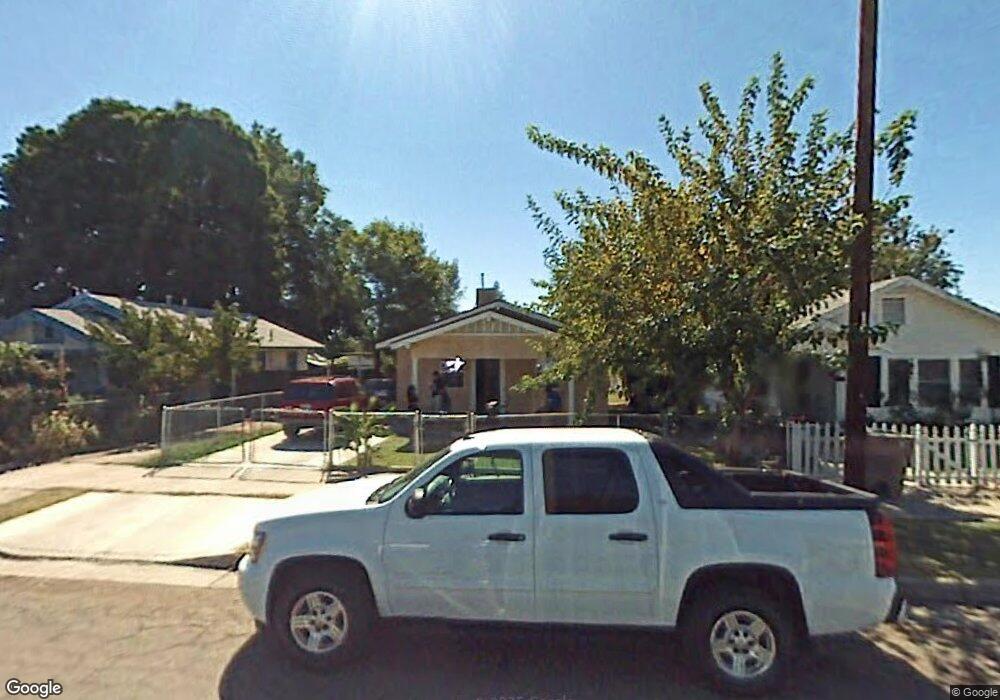
1211 Pacific St Bakersfield, CA 93305
East Bakersfield NeighborhoodEstimated Value: $147,000 - $179,000
2
Beds
1
Bath
672
Sq Ft
$236/Sq Ft
Est. Value
About This Home
This home is located at 1211 Pacific St, Bakersfield, CA 93305 and is currently estimated at $158,348, approximately $235 per square foot. 1211 Pacific St is a home located in Kern County with nearby schools including Jefferson Elementary School, Walter Stiern Middle School, and East Bakersfield High School.
Ownership History
Date
Name
Owned For
Owner Type
Purchase Details
Closed on
Jun 13, 2011
Sold by
Velasquez Georgina
Bought by
Guevara Rivera Diego Guevara and Guevara Rivera Jose Francisco
Current Estimated Value
Purchase Details
Closed on
Jun 2, 2005
Sold by
Dela Rosa Alfredo
Bought by
Velasquez Georgina
Home Financials for this Owner
Home Financials are based on the most recent Mortgage that was taken out on this home.
Original Mortgage
$103,500
Interest Rate
8.8%
Mortgage Type
Purchase Money Mortgage
Purchase Details
Closed on
Jun 10, 1999
Sold by
Duarte Louis
Bought by
Delarosa Alfredo
Home Financials for this Owner
Home Financials are based on the most recent Mortgage that was taken out on this home.
Original Mortgage
$40,388
Interest Rate
7.64%
Mortgage Type
FHA
Create a Home Valuation Report for This Property
The Home Valuation Report is an in-depth analysis detailing your home's value as well as a comparison with similar homes in the area
Home Values in the Area
Average Home Value in this Area
Purchase History
| Date | Buyer | Sale Price | Title Company |
|---|---|---|---|
| Guevara Rivera Diego Guevara | $24,200 | None Available | |
| Velasquez Georgina | $115,000 | Alliance Title | |
| Delarosa Alfredo | $40,000 | Chicago Title Co |
Source: Public Records
Mortgage History
| Date | Status | Borrower | Loan Amount |
|---|---|---|---|
| Previous Owner | Velasquez Georgina | $103,500 | |
| Previous Owner | Delarosa Alfredo | $40,388 | |
| Closed | Delarosa Alfredo | $2,000 |
Source: Public Records
Tax History Compared to Growth
Tax History
| Year | Tax Paid | Tax Assessment Tax Assessment Total Assessment is a certain percentage of the fair market value that is determined by local assessors to be the total taxable value of land and additions on the property. | Land | Improvement |
|---|---|---|---|---|
| 2025 | $1,062 | $30,732 | $8,960 | $21,772 |
| 2024 | $1,031 | $30,131 | $8,785 | $21,346 |
| 2023 | $1,031 | $29,541 | $8,613 | $20,928 |
| 2022 | $990 | $28,963 | $8,445 | $20,518 |
| 2021 | $897 | $28,396 | $8,280 | $20,116 |
| 2020 | $863 | $28,106 | $8,196 | $19,910 |
| 2019 | $847 | $28,106 | $8,196 | $19,910 |
| 2018 | $832 | $27,017 | $7,879 | $19,138 |
| 2017 | $824 | $26,488 | $7,725 | $18,763 |
| 2016 | $786 | $25,970 | $7,574 | $18,396 |
| 2015 | $775 | $25,581 | $7,461 | $18,120 |
| 2014 | $752 | $25,081 | $7,315 | $17,766 |
Source: Public Records
Map
Nearby Homes
- 1200 Oregon St
- 1108 Pacific St
- 1312 Robinson St
- 1231 Quincy St
- 1311 Oregon St
- 1322 Quincy St
- 1309 Flower St
- 1403 Quincy St
- 1409 Quincy St
- 1300 Flower St
- 1408 Quincy St
- 1304 Flower St
- 1107 Monterey St
- 1421 Oregon St
- 1026 Flower St
- 1427 Quincy St
- 1000 Monterey St
- 1414 Monterey St
- 1306 Lincoln St
- 1407 Monterey St
- 1207 Pacific St
- 1215 Pacific St
- 1219 Pacific St
- 1203 Pacific St
- 1415 Robinson St Unit B
- 1415 Robinson St
- 1223 Pacific St
- 1210 Oregon St Unit ABCD
- 1210 Oregon St
- 1210 Oregon St Unit D
- 1212 Oregon St
- 1206 Oregon St
- 1227 Pacific St
- 1216 Oregon St
- 1418 Miller St
- 1220 Oregon St
- 1210 Pacific St
- 1216 Pacific St
- 1204 Pacific St
- 1131 Pacific St