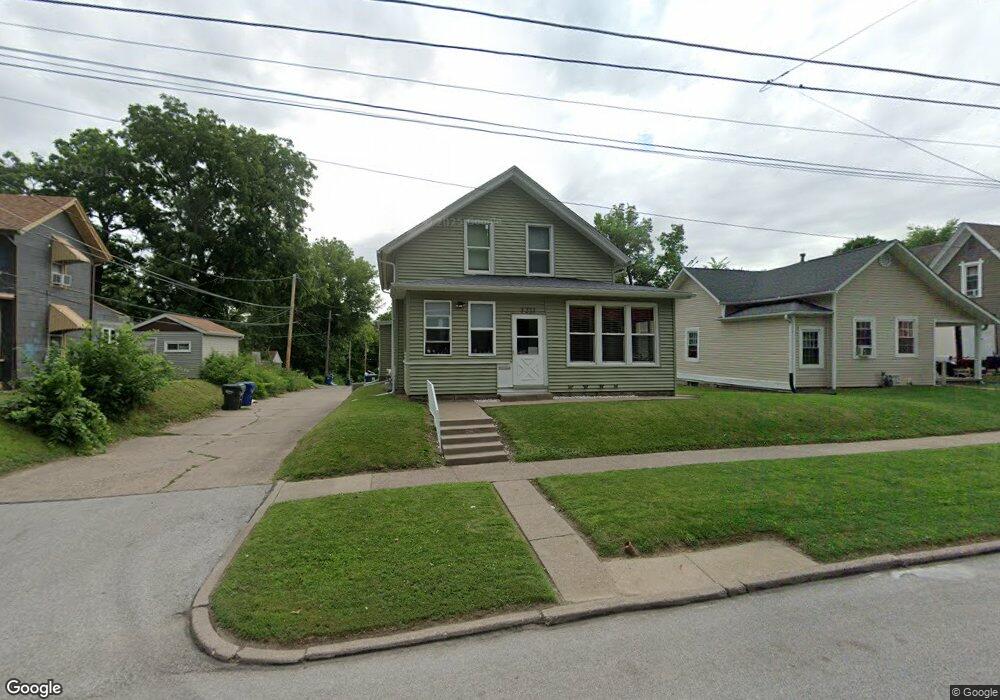
1211 Pershing Ave Davenport, IA 52803
Central Davenport NeighborhoodEstimated Value: $106,000 - $112,359
3
Beds
1
Bath
1,805
Sq Ft
$61/Sq Ft
Est. Value
About This Home
This home is located at 1211 Pershing Ave, Davenport, IA 52803 and is currently estimated at $109,840, approximately $60 per square foot. 1211 Pershing Ave is a home located in Scott County with nearby schools including Madison Elementary School, Frank L. Smart Intermediate School, and Central High School.
Ownership History
Date
Name
Owned For
Owner Type
Purchase Details
Closed on
Jun 30, 2015
Sold by
Gunnar Llc
Bought by
First Financial Group Lc
Current Estimated Value
Purchase Details
Closed on
Mar 12, 2015
Sold by
Estate Of James Richard Charles Whalen
Bought by
Gunnar Llc
Purchase Details
Closed on
Feb 12, 2015
Sold by
Whalen Carol
Bought by
Gunnar Llc
Purchase Details
Closed on
Nov 18, 2010
Sold by
Hennings Catherine and Whalen James R
Bought by
Jackson Kanetha
Home Financials for this Owner
Home Financials are based on the most recent Mortgage that was taken out on this home.
Original Mortgage
$16,396
Interest Rate
8%
Mortgage Type
Seller Take Back
Create a Home Valuation Report for This Property
The Home Valuation Report is an in-depth analysis detailing your home's value as well as a comparison with similar homes in the area
Home Values in the Area
Average Home Value in this Area
Purchase History
| Date | Buyer | Sale Price | Title Company |
|---|---|---|---|
| First Financial Group Lc | $46,000 | Attorney | |
| Gunnar Llc | $7,500 | None Available | |
| Gunnar Llc | $7,500 | None Available | |
| Jackson Kanetha | $40,000 | None Available |
Source: Public Records
Mortgage History
| Date | Status | Borrower | Loan Amount |
|---|---|---|---|
| Previous Owner | Jackson Kanetha | $16,396 |
Source: Public Records
Tax History Compared to Growth
Tax History
| Year | Tax Paid | Tax Assessment Tax Assessment Total Assessment is a certain percentage of the fair market value that is determined by local assessors to be the total taxable value of land and additions on the property. | Land | Improvement |
|---|---|---|---|---|
| 2025 | $1,634 | $103,980 | $12,780 | $91,200 |
| 2024 | $1,594 | $91,400 | $12,780 | $78,620 |
| 2023 | $1,474 | $91,400 | $12,780 | $78,620 |
| 2022 | $1,482 | $69,020 | $5,840 | $63,180 |
| 2021 | $1,482 | $69,020 | $5,840 | $63,180 |
| 2020 | $1,306 | $58,490 | $5,840 | $52,650 |
| 2019 | $1,348 | $60,110 | $5,840 | $54,270 |
| 2018 | $1,258 | $60,110 | $5,840 | $54,270 |
| 2017 | $318 | $57,260 | $5,840 | $51,420 |
| 2016 | $1,032 | $47,150 | $0 | $0 |
| 2015 | $1,032 | $48,260 | $0 | $0 |
| 2014 | $1,072 | $48,730 | $0 | $0 |
| 2013 | $868 | $0 | $0 | $0 |
| 2012 | -- | $51,670 | $5,510 | $46,160 |
Source: Public Records
Map
Nearby Homes
- 1222 Pershing Ave
- 209 E 13th St
- 409 E 14th St
- 320 E 14th St
- 1415 Pershing Ave
- 1323 Leclaire St
- 1215 Farnam St
- 1321 N Main St
- 325 Kirkwood Blvd
- 413 E 9th St
- 230 Kirkwood Blvd
- 914 Farnam St
- 420 Kirkwood Blvd
- 1518 N Main St
- 637 E 15th St
- 715 Iowa St
- 1812 Pershing Ave
- 707 Brady St
- 1127 N Ripley St
- 705 Brady St