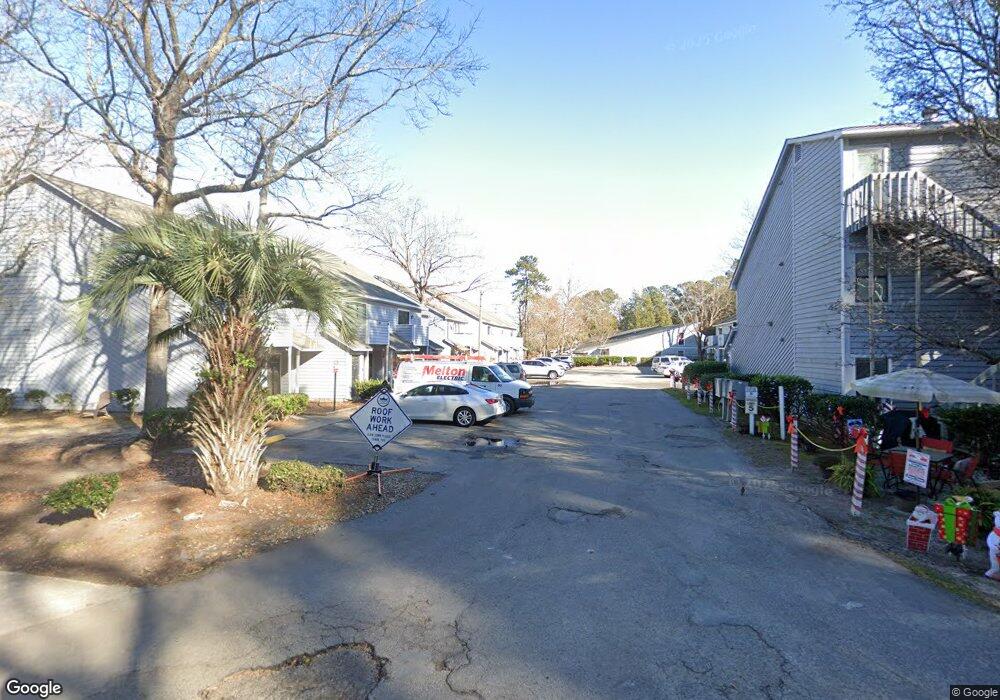
1211 Pridgen Rd Unit 1 Myrtle Beach, SC 29577
Downtown Myrtle Beach NeighborhoodEstimated Value: $147,000 - $210,435
3
Beds
3
Baths
1,600
Sq Ft
$115/Sq Ft
Est. Value
About This Home
This home is located at 1211 Pridgen Rd Unit 1, Myrtle Beach, SC 29577 and is currently estimated at $183,859, approximately $114 per square foot. 1211 Pridgen Rd Unit 1 is a home located in Horry County with nearby schools including Myrtle Beach Child Development Center, Myrtle Beach Primary School, and Myrtle Beach Elementary School.
Ownership History
Date
Name
Owned For
Owner Type
Purchase Details
Closed on
May 29, 2015
Sold by
Belmont Investments Llc
Bought by
Town Squares Schorr Llc
Current Estimated Value
Purchase Details
Closed on
Jul 17, 2014
Sold by
Heavner Bros 2005 Llc
Bought by
Belmont Investments Llc
Home Financials for this Owner
Home Financials are based on the most recent Mortgage that was taken out on this home.
Original Mortgage
$1,806,250
Interest Rate
4.24%
Mortgage Type
Unknown
Purchase Details
Closed on
Nov 17, 2011
Sold by
Heavner Lisa Canaday
Bought by
Heavner Joseph Charles
Purchase Details
Closed on
Nov 3, 2011
Sold by
Heavner Daniel Lee
Bought by
Heavner Lisa Canaday
Purchase Details
Closed on
Dec 23, 2005
Sold by
Heavner Joseph Charles and Heavner Patrick Thomas
Bought by
Heavner Bros 2005 Llc
Create a Home Valuation Report for This Property
The Home Valuation Report is an in-depth analysis detailing your home's value as well as a comparison with similar homes in the area
Home Values in the Area
Average Home Value in this Area
Purchase History
| Date | Buyer | Sale Price | Title Company |
|---|---|---|---|
| Town Squares Schorr Llc | -- | -- | |
| Belmont Investments Llc | $2,075,000 | -- | |
| Heavner Joseph Charles | -- | -- | |
| Heavner Lisa Canaday | -- | -- | |
| Heavner Bros 2005 Llc | -- | None Available | |
| Heavner Joseph Charles | -- | None Available |
Source: Public Records
Mortgage History
| Date | Status | Borrower | Loan Amount |
|---|---|---|---|
| Previous Owner | Belmont Investments Llc | $1,806,250 |
Source: Public Records
Tax History Compared to Growth
Tax History
| Year | Tax Paid | Tax Assessment Tax Assessment Total Assessment is a certain percentage of the fair market value that is determined by local assessors to be the total taxable value of land and additions on the property. | Land | Improvement |
|---|---|---|---|---|
| 2024 | $1,482 | $9,201 | $3,600 | $5,601 |
| 2023 | $1,482 | $5,065 | $840 | $4,225 |
| 2021 | $1,370 | $5,616 | $840 | $4,776 |
| 2020 | $1,307 | $5,616 | $840 | $4,776 |
| 2019 | $1,307 | $5,616 | $840 | $4,776 |
| 2018 | $0 | $4,404 | $780 | $3,624 |
| 2017 | $1,157 | $4,404 | $780 | $3,624 |
| 2016 | -- | $4,404 | $780 | $3,624 |
| 2015 | $936 | $3,600 | $780 | $2,820 |
| 2014 | $834 | $3,300 | $780 | $2,520 |
Source: Public Records
Map
Nearby Homes
- 916 Periwinkle Place
- 978 Periwinkle Place
- 1105 Highway 15
- 904 Periwinkle Place
- 15 Century St Unit 15
- 923 Southpark Dr
- 925 Pine Thicket St
- 128 Hoffman Park Dr
- 128 Hoffman Park Dr Unit 3
- 1303 Highway 15
- 990 Palisade Cir
- 909 Pine Thicket St
- 1083 Pinwheel Loop
- 964 Palisade Cir
- 1065 Pinwheel Loop
- 1025 Penny Ln
- 804 Brenda Place
- 665 Martin St
- 1201 Tiffany Ln Unit H
- 1075 Pinnacle Ln
- 30 History Dr Unit A
- 30 History Dr
- 29 History Dr Unit 29
- 28 History Dr Unit 28
- 27 History Dr Unit WILLIAMSBURG EAST
- 1337 Seafoam Ln
- 26 History Dr Unit 26
- 36 History Dr
- 1201 9th Ave S Unit 29
- 1201 9th Ave S
- 1201 9th Ave S
- 1201 9th Ave S
- 1201 9th Ave S Unit 2
- 1201 9th Ave S Unit 26
- 1201 9th Ave S Unit 14
- 35 History Dr Unit 35
- 35 History Dr Unit 36
- 25 History Dr
- 25 History Dr Unit 25
- 1201 9th Ave S Unit 30A