1211 W 111th Place Chicago, IL 60643
Morgan Park NeighborhoodEstimated Value: $96,926 - $154,000
3
Beds
1
Bath
752
Sq Ft
$158/Sq Ft
Est. Value
About This Home
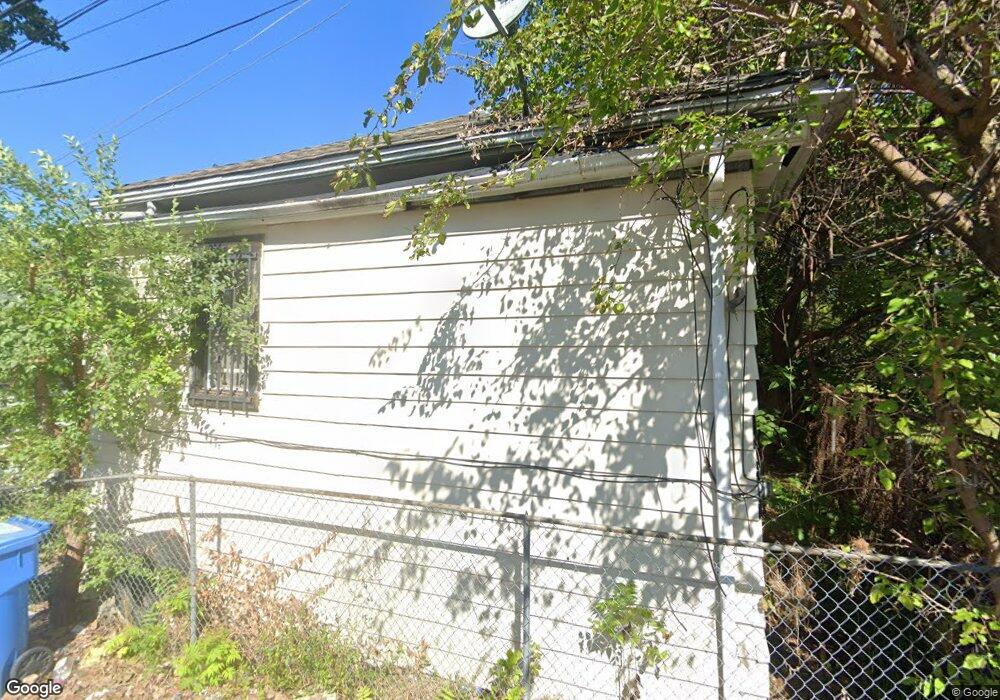
This home is located at 1211 W 111th Place, Chicago, IL 60643 and is currently estimated at $118,982, approximately $158 per square foot. 1211 W 111th Place is a home located in Cook County with nearby schools including John D. Shoop Elementary School and Morgan Park High School.
Ownership History
Date
Name
Owned For
Owner Type
Purchase Details
Closed on
Dec 13, 2011
Sold by
Hch Development Llc
Bought by
Dixon Robert T
Current Estimated Value
Purchase Details
Closed on
Feb 17, 2011
Sold by
Deutsche Bank National Trust Company
Bought by
Hch Development Llc
Purchase Details
Closed on
Nov 3, 2010
Sold by
Orantes Federico
Bought by
Deutsche Bank National Trust Company
Purchase Details
Closed on
Jan 25, 2006
Sold by
Village Sites Inc
Bought by
Orantes Federico
Home Financials for this Owner
Home Financials are based on the most recent Mortgage that was taken out on this home.
Original Mortgage
$112,000
Interest Rate
10.45%
Mortgage Type
Unknown
Purchase Details
Closed on
Dec 19, 2005
Sold by
Orr David D
Bought by
Village Sites Inc
Home Financials for this Owner
Home Financials are based on the most recent Mortgage that was taken out on this home.
Original Mortgage
$112,000
Interest Rate
10.45%
Mortgage Type
Unknown
Create a Home Valuation Report for This Property
The Home Valuation Report is an in-depth analysis detailing your home's value as well as a comparison with similar homes in the area
Home Values in the Area
Average Home Value in this Area
Purchase History
| Date | Buyer | Sale Price | Title Company |
|---|---|---|---|
| Dixon Robert T | $40,000 | None Available | |
| Hch Development Llc | $13,000 | Forum Title Insurance Co | |
| Deutsche Bank National Trust Company | -- | None Available | |
| Orantes Federico | $140,000 | Tristar Title Llc | |
| Village Sites Inc | -- | None Available |
Source: Public Records
Mortgage History
| Date | Status | Borrower | Loan Amount |
|---|---|---|---|
| Previous Owner | Orantes Federico | $112,000 |
Source: Public Records
Tax History Compared to Growth
Tax History
| Year | Tax Paid | Tax Assessment Tax Assessment Total Assessment is a certain percentage of the fair market value that is determined by local assessors to be the total taxable value of land and additions on the property. | Land | Improvement |
|---|---|---|---|---|
| 2024 | $846 | $6,900 | $2,250 | $4,650 |
| 2023 | $825 | $4,000 | $2,025 | $1,975 |
| 2022 | $825 | $4,000 | $2,025 | $1,975 |
| 2021 | $806 | $3,999 | $2,025 | $1,974 |
| 2020 | $1,555 | $6,963 | $2,437 | $4,526 |
| 2019 | $1,541 | $7,652 | $2,437 | $5,215 |
| 2018 | $1,515 | $7,652 | $2,437 | $5,215 |
| 2017 | $1,745 | $8,088 | $2,250 | $5,838 |
| 2016 | $1,624 | $8,088 | $2,250 | $5,838 |
| 2015 | $1,486 | $8,088 | $2,250 | $5,838 |
| 2014 | $1,405 | $7,554 | $2,062 | $5,492 |
| 2013 | $1,377 | $7,554 | $2,062 | $5,492 |
Source: Public Records
Map
Nearby Homes
- 1313 W 112th St
- 1105 W 111th Place
- 1203 W 110th St
- 1115 W 110th St
- 11345 S Ada St
- 1208 W 109th Place
- 1416 W 110th Place
- 11367 S Aberdeen St
- 11328 S Morgan St
- 11015 S Morgan St
- 11440 S Throop St
- 10918 S Morgan St
- 11310 S Peoria St
- 11147 S Peoria St
- 11518 S Aberdeen St
- 11531 S Throop St
- 11530 S Racine Ave
- 1342 W 108th Place
- 1001-1021 W 115th St
- 10947 S Peoria St
- 1215 W 111th Place
- 1221 W 111th Place
- 11138 S Ave M S Unit 2
- 1210 W 112th St
- 1212 W 112th St
- 1212 W 112th St
- 1218 W 112th St
- 1227 W 111th Place
- 1200 W 112th St
- 1222 W 112th St
- 1210 W 111th Place
- 1159 W 111th Place
- 1208 W 111th Place
- 1118 S Racine Ave
- 1157 W 111th Place
- 1226 W 112th St
- 1220 W 111th Place
- 1220 W 111th Place
- 1220 W 111th Place
- 11118 S Racine Ave