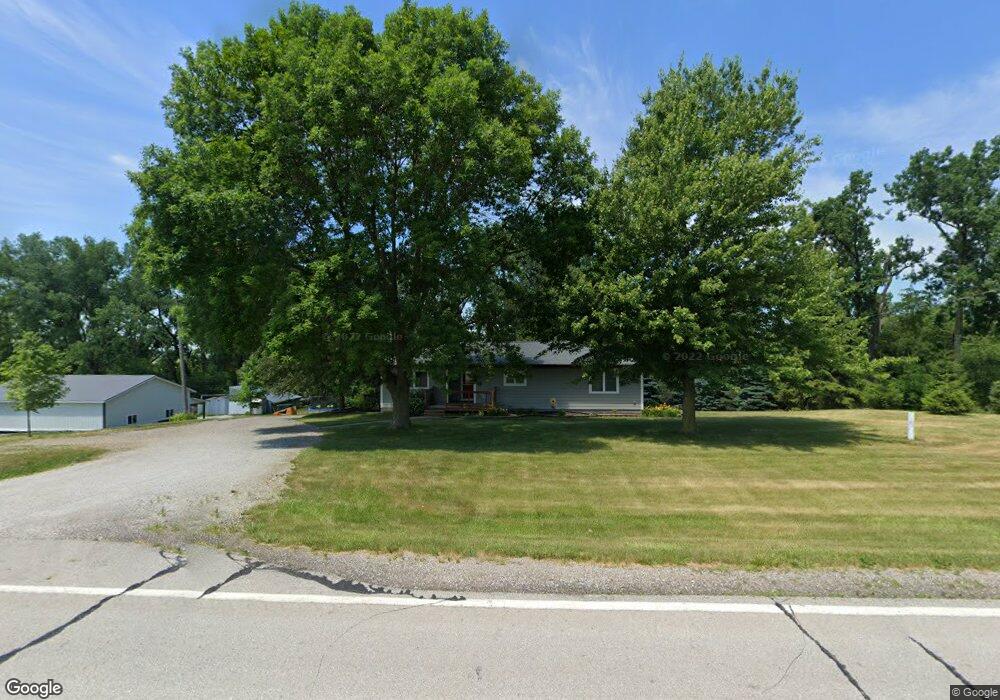
12118 NE 112th St Maxwell, IA 50161
Estimated Value: $293,000 - $630,000
3
Beds
1
Bath
1,508
Sq Ft
$267/Sq Ft
Est. Value
About This Home
This home is located at 12118 NE 112th St, Maxwell, IA 50161 and is currently estimated at $403,014, approximately $267 per square foot. 12118 NE 112th St is a home located in Polk County with nearby schools including Anderson Elementary School, Morris Elementary School, and Washington County Middle School.
Ownership History
Date
Name
Owned For
Owner Type
Purchase Details
Closed on
May 5, 2010
Sold by
Us Bank National Association
Bought by
Noord Kari A Vande
Current Estimated Value
Home Financials for this Owner
Home Financials are based on the most recent Mortgage that was taken out on this home.
Original Mortgage
$114,000
Outstanding Balance
$76,527
Interest Rate
5.16%
Mortgage Type
New Conventional
Estimated Equity
$326,487
Purchase Details
Closed on
Nov 14, 2006
Sold by
Mayes Angela
Bought by
Creach Chad and Creach Jackie
Home Financials for this Owner
Home Financials are based on the most recent Mortgage that was taken out on this home.
Original Mortgage
$40,600
Interest Rate
6.4%
Mortgage Type
Stand Alone Second
Purchase Details
Closed on
Jun 21, 2004
Sold by
Taylor Larry J and Taylor Claudette M
Bought by
Mayes Craig L and Mayes Angela M
Home Financials for this Owner
Home Financials are based on the most recent Mortgage that was taken out on this home.
Original Mortgage
$60,000
Interest Rate
6.46%
Mortgage Type
Purchase Money Mortgage
Create a Home Valuation Report for This Property
The Home Valuation Report is an in-depth analysis detailing your home's value as well as a comparison with similar homes in the area
Home Values in the Area
Average Home Value in this Area
Purchase History
| Date | Buyer | Sale Price | Title Company |
|---|---|---|---|
| Noord Kari A Vande | $119,500 | None Available | |
| Creach Chad | $202,500 | None Available | |
| Mayes Craig L | $169,500 | -- |
Source: Public Records
Mortgage History
| Date | Status | Borrower | Loan Amount |
|---|---|---|---|
| Open | Noord Kari A Vande | $114,000 | |
| Previous Owner | Creach Chad | $40,600 | |
| Previous Owner | Creach Chad | $162,400 | |
| Previous Owner | Mayes Craig L | $60,000 |
Source: Public Records
Tax History Compared to Growth
Tax History
| Year | Tax Paid | Tax Assessment Tax Assessment Total Assessment is a certain percentage of the fair market value that is determined by local assessors to be the total taxable value of land and additions on the property. | Land | Improvement |
|---|---|---|---|---|
| 2025 | $3,980 | $296,200 | $70,800 | $225,400 |
| 2024 | $3,980 | $270,300 | $63,400 | $206,900 |
| 2023 | $3,968 | $270,300 | $63,400 | $206,900 |
| 2022 | $3,850 | $226,600 | $54,000 | $172,600 |
| 2021 | $3,528 | $221,100 | $54,000 | $167,100 |
| 2020 | $3,480 | $184,700 | $50,000 | $134,700 |
| 2019 | $3,334 | $184,700 | $50,000 | $134,700 |
| 2018 | $3,268 | $171,000 | $45,500 | $125,500 |
| 2017 | $3,238 | $171,000 | $45,500 | $125,500 |
| 2016 | $3,162 | $165,500 | $43,400 | $122,100 |
| 2015 | $3,162 | $165,500 | $43,400 | $122,100 |
| 2014 | $3,286 | $178,100 | $45,600 | $132,500 |
Source: Public Records
Map
Nearby Homes
- 10803 NE 118th Ave
- 14039 NE 112th St
- 11301 NE 110th Ave
- TBD NE 134th Ave
- 5768 W 148th St N
- 5280 Fairview Ln
- 5460 Fairview Ln
- 5220 Fairview Ln
- 5397 Fairview Ln
- 5527 Fairview Ln
- 5517 Fairview Ln
- 5520 Fairview Ln
- 5457 Fariview Ln
- 5277 Fairview Ln
- 5217 Fairview Ln
- 5157 Fairview Ln
- 5400 Fairview Ln
- 5530 Fairview Ln
- 5340 Fariview Ln
- 5337 Fairview Ln
- 12034 NE 112th St
- 12320 NE 112th St
- 12283 NE 112th St
- 11130 NE 118th Ave
- 11750 NE 112th St
- 000 NE 112th St
- 10500 NE 112th St
- 10893 NE 126th Ave
- 11525 NE 118th Ave
- 11645 NE 112th St
- 11376 NE 126th Ave
- 10900 NE 126th Ave
- 10632 NE 118th Ave
- 11687 NE 126th Ave
- 12787 NE 112th St
- 11555 NE Hubbell Way
- 12187 NE 104th St
- 11450 NE Hubbell Rd
- 11410 NE Hubbell Way