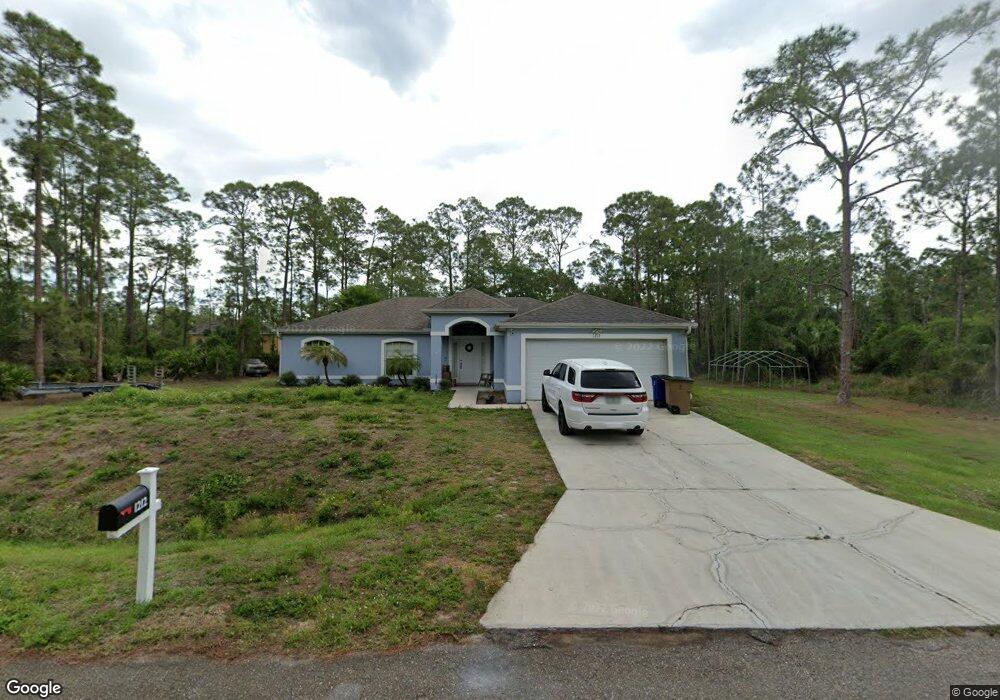
1212 Broadway Ave Unit 2 Lehigh Acres, FL 33972
Joel NeighborhoodEstimated Value: $296,158 - $357,000
3
Beds
2
Baths
1,600
Sq Ft
$198/Sq Ft
Est. Value
About This Home
This home is located at 1212 Broadway Ave Unit 2, Lehigh Acres, FL 33972 and is currently estimated at $317,290, approximately $198 per square foot. 1212 Broadway Ave Unit 2 is a home located in Lee County with nearby schools including Lehigh Elementary School, The Alva School, and Gateway Elementary School.
Ownership History
Date
Name
Owned For
Owner Type
Purchase Details
Closed on
Apr 16, 2019
Sold by
Goffena Jo Ellen and Goffena Lawrence L
Bought by
Goffena Ryan Louis
Current Estimated Value
Purchase Details
Closed on
Sep 12, 2008
Sold by
Lee Cape Llc
Bought by
Goffena Jo Ellen
Purchase Details
Closed on
Apr 28, 2008
Sold by
Hernandez Raul
Bought by
Lee Cape Llc
Purchase Details
Closed on
Aug 15, 2005
Sold by
Landmark Homes Of South Florida Inc
Bought by
Hernandez Raul
Home Financials for this Owner
Home Financials are based on the most recent Mortgage that was taken out on this home.
Original Mortgage
$225,000
Interest Rate
5.57%
Mortgage Type
Fannie Mae Freddie Mac
Purchase Details
Closed on
Mar 11, 2003
Sold by
Clerk Circuit Court
Bought by
Landmark Homes S Fl Inc
Create a Home Valuation Report for This Property
The Home Valuation Report is an in-depth analysis detailing your home's value as well as a comparison with similar homes in the area
Home Values in the Area
Average Home Value in this Area
Purchase History
| Date | Buyer | Sale Price | Title Company |
|---|---|---|---|
| Goffena Ryan Louis | -- | Attorney | |
| Goffena Jo Ellen | $110,000 | Olympic Title Llc | |
| Lee Cape Llc | $249,400 | Attorney | |
| Hernandez Raul | $79,900 | Florida West Coast Title Ins | |
| Landmark Homes S Fl Inc | $2,700 | -- |
Source: Public Records
Mortgage History
| Date | Status | Borrower | Loan Amount |
|---|---|---|---|
| Previous Owner | Hernandez Raul | $225,000 |
Source: Public Records
Tax History Compared to Growth
Tax History
| Year | Tax Paid | Tax Assessment Tax Assessment Total Assessment is a certain percentage of the fair market value that is determined by local assessors to be the total taxable value of land and additions on the property. | Land | Improvement |
|---|---|---|---|---|
| 2025 | $2,432 | $174,004 | -- | -- |
| 2024 | $2,307 | $169,100 | -- | -- |
| 2023 | $2,307 | $164,175 | $0 | $0 |
| 2022 | $2,170 | $159,393 | $0 | $0 |
| 2021 | $2,092 | $163,005 | $6,500 | $156,505 |
| 2020 | $2,097 | $152,613 | $6,000 | $146,613 |
| 2019 | $2,328 | $146,150 | $5,500 | $140,650 |
| 2018 | $2,180 | $132,443 | $5,200 | $127,243 |
| 2017 | $2,096 | $128,383 | $4,410 | $123,973 |
| 2016 | $1,910 | $109,222 | $4,410 | $104,812 |
| 2015 | $1,727 | $90,700 | $4,120 | $86,580 |
| 2014 | $1,551 | $82,892 | $3,000 | $79,892 |
| 2013 | -- | $70,209 | $3,200 | $67,009 |
Source: Public Records
Map
Nearby Homes
- 1303 Broadway Ave
- 1410 Washington Ave
- 1521-1523 E 12th St
- 1219 Washington Ave
- 1310 Dayton Ave
- 905 E 6th St
- 608 Myers Ct
- 1818 Honduras Loop
- 607 E 8th St
- 1211 Columbus Ave
- 1822 Jacinto Ave
- 1707 E 6th St
- 342 Tyrone Ave
- 1404 W 17th St
- 904 W 17th St
- 1412 5th Ave
- 1824 Jacinto Ave
- 1909 Moore Ave
- 1207 Columbus Ave
- 1209 Columbus Ave
- 1216 Broadway Ave
- 1211 Dayton Ave
- 1215 Broadway Ave
- 1223 Broadway Ave
- 1205 Broadway Ave
- 1203 Broadway Ave
- 1121 Broadway Ave
- 1206 Broadway Ave
- 1210 Broadway Ave
- 703 Broadway Ave
- 1305 Broadway Ave
- 1215 Dayton Ave
- 1209 Dayton Ave
- 1205 Dayton Ave
- 1013 Dayton Ave
- 1021 Dayton Ave
- 1105 Dayton Ave
- 1319 Dayton Ave
- 1210 Dayton Ave
- 1207 Dayton Ave