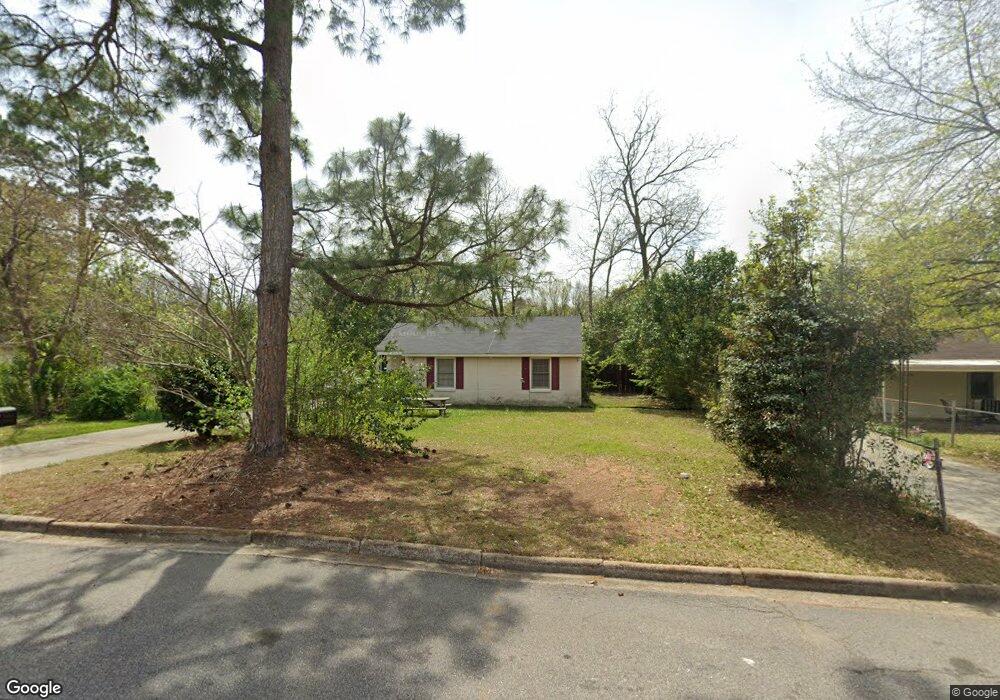
1212 Hillridge Dr Unit A Macon, GA 31206
Estimated Value: $53,796 - $67,000
3
Beds
1
Bath
1,092
Sq Ft
$54/Sq Ft
Est. Value
About This Home
This home is located at 1212 Hillridge Dr Unit A, Macon, GA 31206 and is currently estimated at $58,949, approximately $53 per square foot. 1212 Hillridge Dr Unit A is a home located in Bibb County with nearby schools including Bruce Elementary School, Rutland Middle School, and Rutland High School.
Ownership History
Date
Name
Owned For
Owner Type
Purchase Details
Closed on
Jan 25, 2021
Sold by
Alobeidy Naktel
Bought by
Parker Debra
Current Estimated Value
Purchase Details
Closed on
Jan 31, 2017
Sold by
American Ira Llc Fbo
Bought by
Obeidy Naktel Al
Purchase Details
Closed on
Dec 1, 2012
Sold by
Hyc Financial Llc
Bought by
American Ira Llc and Judy F Hudson Ira
Purchase Details
Closed on
Oct 17, 2011
Sold by
Federal National Mortgage Association
Bought by
Hyc Financial Llc
Purchase Details
Closed on
Aug 12, 2011
Sold by
Garrett Sherry L
Bought by
Jpmorgan Chase Bank National Association
Purchase Details
Closed on
Jun 8, 2011
Sold by
Jpmorgan Chase Bank National Association
Bought by
Federal National Mortgage Association
Purchase Details
Closed on
Aug 16, 2004
Sold by
Garrett Sherry L
Bought by
Comstock Real Estate Llc
Purchase Details
Closed on
Feb 13, 2003
Purchase Details
Closed on
Dec 19, 2002
Create a Home Valuation Report for This Property
The Home Valuation Report is an in-depth analysis detailing your home's value as well as a comparison with similar homes in the area
Home Values in the Area
Average Home Value in this Area
Purchase History
| Date | Buyer | Sale Price | Title Company |
|---|---|---|---|
| Parker Debra | -- | None Available | |
| Obeidy Naktel Al | $8,000 | -- | |
| American Ira Llc | $4,350 | None Available | |
| Hudson Judy F Ira By | $4,400 | -- | |
| Hyc Financial Llc | $4,350 | Servicelink | |
| Jpmorgan Chase Bank National Association | $10,900 | None Available | |
| Federal National Mortgage Association | $10,900 | None Available | |
| Comstock Real Estate Llc | -- | -- | |
| -- | $53,000 | -- | |
| -- | $26,600 | -- |
Source: Public Records
Tax History Compared to Growth
Tax History
| Year | Tax Paid | Tax Assessment Tax Assessment Total Assessment is a certain percentage of the fair market value that is determined by local assessors to be the total taxable value of land and additions on the property. | Land | Improvement |
|---|---|---|---|---|
| 2025 | $208 | $15,457 | $2,850 | $12,607 |
| 2024 | $202 | $14,946 | $3,600 | $11,346 |
| 2023 | $235 | $14,946 | $3,600 | $11,346 |
| 2022 | $84 | $9,435 | $1,640 | $7,795 |
| 2021 | $290 | $7,640 | $1,476 | $6,164 |
| 2020 | $233 | $6,008 | $1,476 | $4,532 |
| 2019 | $235 | $6,008 | $1,476 | $4,532 |
| 2018 | $372 | $5,598 | $1,066 | $4,532 |
| 2017 | $209 | $5,583 | $1,066 | $4,517 |
| 2016 | $212 | $6,117 | $1,148 | $4,969 |
| 2015 | $300 | $6,117 | $1,148 | $4,969 |
| 2014 | $344 | $6,117 | $1,148 | $4,969 |
Source: Public Records
Map
Nearby Homes
- 1220 Hillridge Dr
- 1239 Hillridge Dr
- 1216 Buena Vista Ave
- 1170 Buena Vista Ave
- 4142 Buena Vista Ave
- 1156 Triple Hill Dr
- 4154 Houston Ave
- 4187 Buena Vista Ave
- 1094 Triple Hill Dr
- 1325 Triple Hill Dr
- 4071 Marse Allen Rd
- 1175 Hartley St
- 1189 Hartley St
- 935 Troupe St
- 1040 Triple Hill Dr
- 4235 Mikado Ave
- 1359 Hillridge Dr
- 4006 Emory Dr
- 4067 Mikado Ave
- 1212 Hillridge Dr
- 1212 Hillridge Dr Unit B
- 4169 Pinson St
- 4179 Pinson St
- 4157 Pinson St
- 1226 Hillridge Dr
- 1232 Hillridge Dr
- 1211 Hillridge Dr
- 4185 Pinson St
- 1219 Hillridge Dr
- 4145 Pinson St
- 4162 Pinson St
- 1211 Buena Vista Ave
- 1223 Hillridge Dr
- 1227 Buena Vista Ave
- 4180 Pinson St
- 1229 Buena Vista Ave
- 1240 Hillridge Dr
- 1231 Hillridge Dr
- 4137 Pinson St