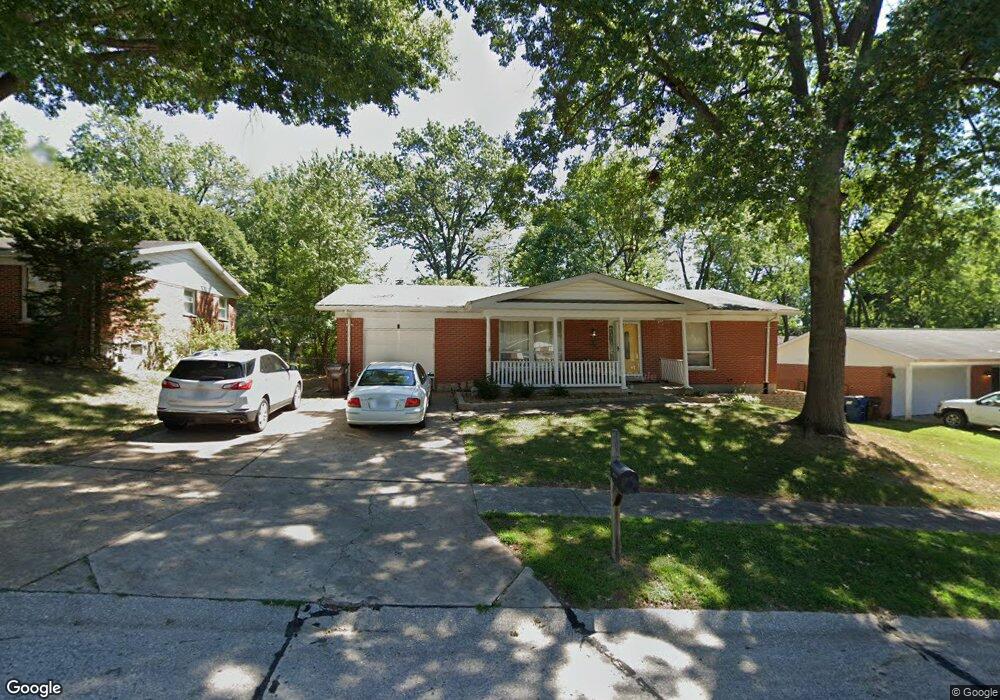
1212 Hudson Hills Dr Saint Louis, MO 63135
Estimated Value: $188,050 - $220,000
3
Beds
3
Baths
1,468
Sq Ft
$143/Sq Ft
Est. Value
About This Home
This home is located at 1212 Hudson Hills Dr, Saint Louis, MO 63135 and is currently estimated at $209,263, approximately $142 per square foot. 1212 Hudson Hills Dr is a home located in St. Louis County with nearby schools including Lee Hamilton Elementary School, Ferguson Middle School, and McCluer High School.
Ownership History
Date
Name
Owned For
Owner Type
Purchase Details
Closed on
Sep 30, 2009
Sold by
Halbig Fred and Halbig Joan
Bought by
Holland Theresa A
Current Estimated Value
Home Financials for this Owner
Home Financials are based on the most recent Mortgage that was taken out on this home.
Original Mortgage
$109,513
Outstanding Balance
$71,656
Interest Rate
5.12%
Mortgage Type
New Conventional
Estimated Equity
$137,607
Purchase Details
Closed on
Feb 6, 2009
Sold by
National City Bank
Bought by
Halbig Fred and Halbig Joan
Purchase Details
Closed on
Mar 11, 2008
Sold by
Haynes James and Bibbins Veronica
Bought by
National City Bank
Purchase Details
Closed on
Nov 6, 2002
Sold by
Mueller Richard F and Mueller Margaret C
Bought by
Haynes James and Bibbins Veronica
Home Financials for this Owner
Home Financials are based on the most recent Mortgage that was taken out on this home.
Original Mortgage
$87,200
Interest Rate
7.25%
Create a Home Valuation Report for This Property
The Home Valuation Report is an in-depth analysis detailing your home's value as well as a comparison with similar homes in the area
Home Values in the Area
Average Home Value in this Area
Purchase History
| Date | Buyer | Sale Price | Title Company |
|---|---|---|---|
| Holland Theresa A | $112,900 | None Available | |
| Halbig Fred | -- | None Available | |
| National City Bank | $99,738 | None Available | |
| Haynes James | $109,000 | -- |
Source: Public Records
Mortgage History
| Date | Status | Borrower | Loan Amount |
|---|---|---|---|
| Open | Holland Theresa A | $109,513 | |
| Previous Owner | Haynes James | $87,200 | |
| Closed | Haynes James | $21,800 | |
| Closed | National City Bank | -- |
Source: Public Records
Tax History Compared to Growth
Tax History
| Year | Tax Paid | Tax Assessment Tax Assessment Total Assessment is a certain percentage of the fair market value that is determined by local assessors to be the total taxable value of land and additions on the property. | Land | Improvement |
|---|---|---|---|---|
| 2025 | $2,240 | $35,930 | $3,480 | $32,450 |
| 2024 | $2,240 | $31,030 | $4,010 | $27,020 |
| 2023 | $2,227 | $31,030 | $4,010 | $27,020 |
| 2022 | $2,022 | $24,530 | $5,210 | $19,320 |
| 2021 | $1,957 | $24,530 | $5,210 | $19,320 |
| 2020 | $1,878 | $21,150 | $2,910 | $18,240 |
| 2019 | $1,842 | $21,150 | $2,910 | $18,240 |
| 2018 | $1,658 | $16,950 | $2,570 | $14,380 |
| 2017 | $1,625 | $16,950 | $2,570 | $14,380 |
| 2016 | $1,529 | $15,680 | $2,570 | $13,110 |
| 2015 | $1,540 | $15,680 | $2,570 | $13,110 |
| 2014 | $1,502 | $15,120 | $3,400 | $11,720 |
Source: Public Records
Map
Nearby Homes
- 1315 Hendrick Dr
- 10540 Williamsfield Dr
- 1400 Hudson Rd
- 1515 Beecher Dr
- 1355 Stein Rd
- 1516 Cargill Dr
- 10207 Tanner Dr
- 925 Dyerdown Ave
- 10619 Alliance Dr
- 1705 Cargill Dr
- 926 Westwold Ave
- 1715 Hudson Rd
- 1715 Beecher Dr
- 931 Thatcher Ave
- 823 Le Maisson Dr
- 1743 Atmore Dr
- 410 Argent Ave
- 330 N Floridale Ave
- 339 Wedge Dr
- 1562 Starlight Dr
- 1206 Hudson Hills Dr
- 1218 Hudson Hills Dr
- 1241 Elkhart Dr
- 1200 Hudson Hills Dr
- 1235 Elkhart Dr
- 1247 Elkhart Dr
- 1224 Hudson Hills Dr
- 1209 Hudson Hills Dr
- 1215 Hudson Hills Dr
- 1229 Elkhart Dr
- 1331 Hendrick Dr
- 1345 Hudson Hills Dr
- 1253 Elkhart Dr
- 1221 Hudson Hills Dr
- 1230 Hudson Hills Dr
- 1319 Hendrick Dr
- 1223 Elkhart Dr
- 1259 Elkhart Dr
- 1227 Hudson Hills Dr
- 1353 Hudson Hills Dr