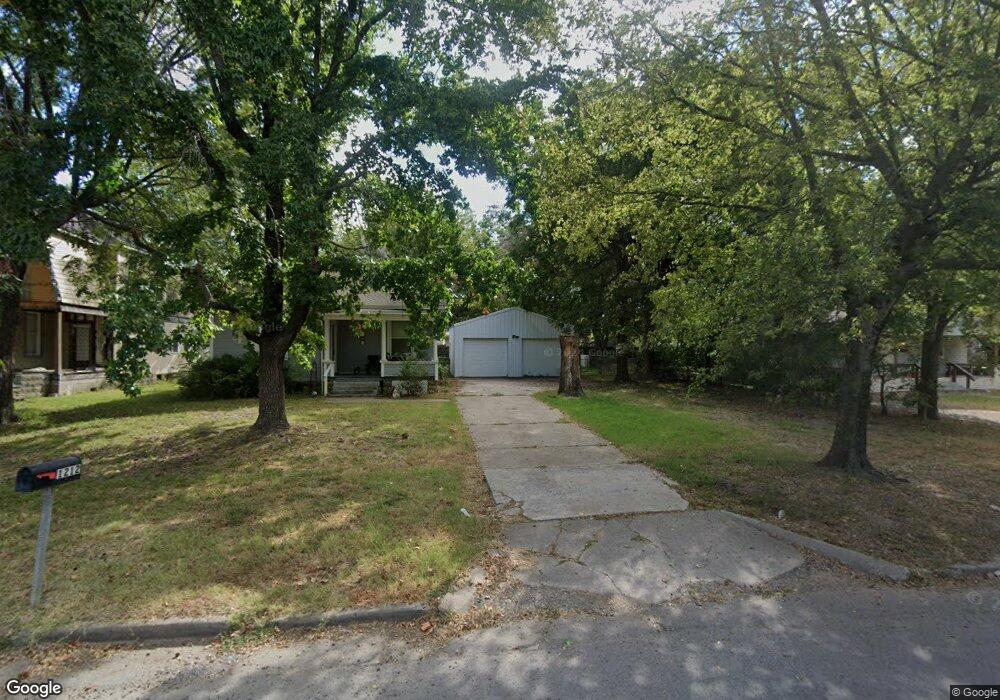
1212 Locust St Muskogee, OK 74403
Central Muskogee NeighborhoodEstimated Value: $86,785 - $163,000
3
Beds
2
Baths
1,238
Sq Ft
$87/Sq Ft
Est. Value
About This Home
This home is located at 1212 Locust St, Muskogee, OK 74403 and is currently estimated at $107,446, approximately $86 per square foot. 1212 Locust St is a home located in Muskogee County with nearby schools including Irving Elementary School, 8th & 9th Grade Academy @ Alice Robertson, and Muskogee High School.
Ownership History
Date
Name
Owned For
Owner Type
Purchase Details
Closed on
Mar 3, 2025
Sold by
Boling Haley and Christie Nicholas
Bought by
Bural Erik Trevor
Current Estimated Value
Home Financials for this Owner
Home Financials are based on the most recent Mortgage that was taken out on this home.
Original Mortgage
$100,880
Outstanding Balance
$100,286
Interest Rate
6.96%
Mortgage Type
New Conventional
Estimated Equity
$7,160
Purchase Details
Closed on
Feb 4, 2010
Sold by
Aldridge Jerry P and Aldridge Shirley L
Bought by
Boling Haley and Christie Nicholas
Home Financials for this Owner
Home Financials are based on the most recent Mortgage that was taken out on this home.
Original Mortgage
$72,853
Interest Rate
5.16%
Mortgage Type
FHA
Purchase Details
Closed on
Sep 16, 2002
Purchase Details
Closed on
Dec 10, 2001
Purchase Details
Closed on
Aug 1, 1989
Create a Home Valuation Report for This Property
The Home Valuation Report is an in-depth analysis detailing your home's value as well as a comparison with similar homes in the area
Home Values in the Area
Average Home Value in this Area
Purchase History
| Date | Buyer | Sale Price | Title Company |
|---|---|---|---|
| Bural Erik Trevor | $104,000 | Stewart Title | |
| Bural Erik Trevor | $104,000 | Stewart Title | |
| Boling Haley | $73,000 | None Available | |
| -- | $7,500 | -- | |
| -- | $500 | -- | |
| -- | $17,000 | -- |
Source: Public Records
Mortgage History
| Date | Status | Borrower | Loan Amount |
|---|---|---|---|
| Open | Bural Erik Trevor | $100,880 | |
| Closed | Bural Erik Trevor | $100,880 | |
| Previous Owner | Boling Haley | $72,853 |
Source: Public Records
Tax History
| Year | Tax Paid | Tax Assessment Tax Assessment Total Assessment is a certain percentage of the fair market value that is determined by local assessors to be the total taxable value of land and additions on the property. | Land | Improvement |
|---|---|---|---|---|
| 2025 | $758 | $6,771 | $828 | $5,943 |
| 2024 | $698 | $6,409 | $828 | $5,581 |
| 2023 | $698 | $6,456 | $497 | $5,959 |
| 2022 | $643 | $6,456 | $497 | $5,959 |
| 2021 | $672 | $6,712 | $378 | $6,334 |
| 2020 | $673 | $6,712 | $378 | $6,334 |
| 2019 | $668 | $6,714 | $379 | $6,335 |
| 2018 | $654 | $6,714 | $379 | $6,335 |
| 2017 | $633 | $6,712 | $378 | $6,334 |
| 2016 | $641 | $6,729 | $378 | $6,351 |
| 2015 | $635 | $6,729 | $378 | $6,351 |
| 2014 | $646 | $6,729 | $378 | $6,351 |
Source: Public Records
Map
Nearby Homes
Your Personal Tour Guide
Ask me questions while you tour the home.