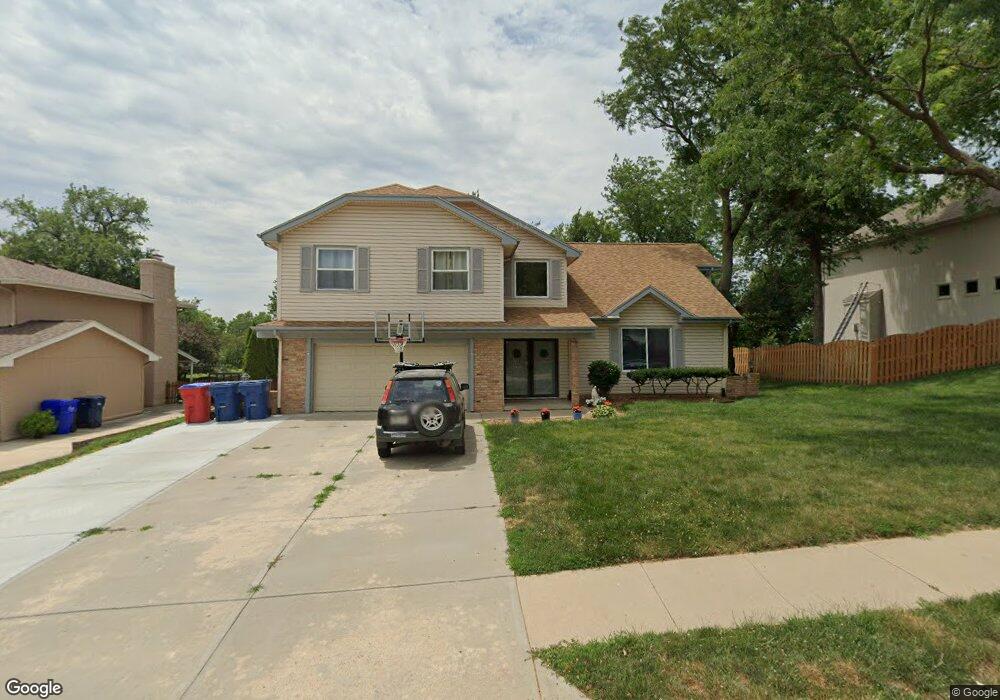
1212 Macarthur Dr Papillion, NE 68046
Estimated Value: $370,595 - $414,000
4
Beds
4
Baths
3,142
Sq Ft
$125/Sq Ft
Est. Value
About This Home
This home is located at 1212 Macarthur Dr, Papillion, NE 68046 and is currently estimated at $392,149, approximately $124 per square foot. 1212 Macarthur Dr is a home located in Sarpy County with nearby schools including Trumble Park Elementary School, Papillion Middle School, and Papillion La Vista South High School.
Ownership History
Date
Name
Owned For
Owner Type
Purchase Details
Closed on
Dec 30, 2020
Sold by
Sindelar Ronald G and Sindelar Esther M
Bought by
Poncini Rebecca Eileen and Poncini Raymond Michael
Current Estimated Value
Home Financials for this Owner
Home Financials are based on the most recent Mortgage that was taken out on this home.
Original Mortgage
$135,000
Interest Rate
2.7%
Mortgage Type
New Conventional
Purchase Details
Closed on
Nov 6, 2003
Sold by
Bitter Michael R and Bitter Deborah M
Bought by
Sindelar Ronald and Sindelar Esther
Purchase Details
Closed on
Jul 14, 2003
Sold by
Bitter Michael R
Bought by
Bitter Deborah
Purchase Details
Closed on
Dec 10, 1998
Sold by
Bitter Michael R and Bitter Deborah M
Bought by
Bitter Michael R and Bitter Deborah M
Home Financials for this Owner
Home Financials are based on the most recent Mortgage that was taken out on this home.
Original Mortgage
$132,950
Interest Rate
6.87%
Create a Home Valuation Report for This Property
The Home Valuation Report is an in-depth analysis detailing your home's value as well as a comparison with similar homes in the area
Home Values in the Area
Average Home Value in this Area
Purchase History
| Date | Buyer | Sale Price | Title Company |
|---|---|---|---|
| Poncini Rebecca Eileen | -- | Midwest Title | |
| Sindelar Ronald | $140,841 | -- | |
| Bitter Deborah | -- | -- | |
| Bitter Michael R | -- | -- |
Source: Public Records
Mortgage History
| Date | Status | Borrower | Loan Amount |
|---|---|---|---|
| Previous Owner | Poncini Rebecca Eileen | $135,000 | |
| Previous Owner | Bitter Michael R | $132,950 |
Source: Public Records
Tax History
| Year | Tax Paid | Tax Assessment Tax Assessment Total Assessment is a certain percentage of the fair market value that is determined by local assessors to be the total taxable value of land and additions on the property. | Land | Improvement |
|---|---|---|---|---|
| 2025 | $5,247 | $358,139 | $48,000 | $310,139 |
| 2024 | $5,834 | $349,868 | $43,000 | $306,868 |
| 2023 | $5,834 | $309,828 | $39,000 | $270,828 |
| 2022 | $5,628 | $275,764 | $37,000 | $238,764 |
| 2021 | $5,104 | $245,160 | $34,000 | $211,160 |
| 2020 | $4,959 | $235,819 | $34,000 | $201,819 |
| 2019 | $4,649 | $221,239 | $31,000 | $190,239 |
| 2018 | $4,343 | $203,504 | $26,000 | $177,504 |
| 2017 | $4,230 | $198,273 | $24,000 | $174,273 |
| 2016 | $4,023 | $188,863 | $24,000 | $164,863 |
| 2015 | $3,997 | $188,199 | $24,000 | $164,199 |
| 2014 | $3,846 | $179,842 | $24,000 | $155,842 |
| 2012 | -- | $182,846 | $24,000 | $158,846 |
Source: Public Records
Map
Nearby Homes
- 919 Rawhide Rd
- 1108 Conestoga Rd
- Lot 290 Pintail Dr
- LOT 263 Ashbury Hills
- LOT 58 Ashbury Hills
- Lot 130 Shadow Lake 2
- TBD S 98th St
- Lot 27 Terrace
- 907 Woodland Ave
- 1114 Woodview Cir
- 1005 Conestoga Rd
- Lot 28 Ashbury Hills
- 259 Ashbury Hils St
- 12378 Lake Vista Dr
- 262 Ashbury Hills St
- 235 Lot St
- 613 Valley Rd
- Lot 39
- 1004 Valleyview Dr
- Lot 52 Unit Lot 52
- 1214 Macarthur Dr
- 1210 Macarthur Dr
- 1124 Palomino Cir
- 1216 Macarthur Dr
- 1125 Palomino Cir
- 1211 Macarthur Dr
- 1122 Palomino Cir
- 1213 Macarthur Dr
- 1208 Macarthur Dr
- 1215 Macarthur Dr
- 1215 Macarthur Dr
- 1209 Macarthur Dr
- 1218 Macarthur Dr
- 1103 Rawhide Rd
- 1106 Apache Cir
- 1123 Palomino Cir
- 1105 Rawhide Rd
- 1207 Macarthur Dr
- 1207 Mac Arthur Dr
- 1006 Berkley Ave
Your Personal Tour Guide
Ask me questions while you tour the home.