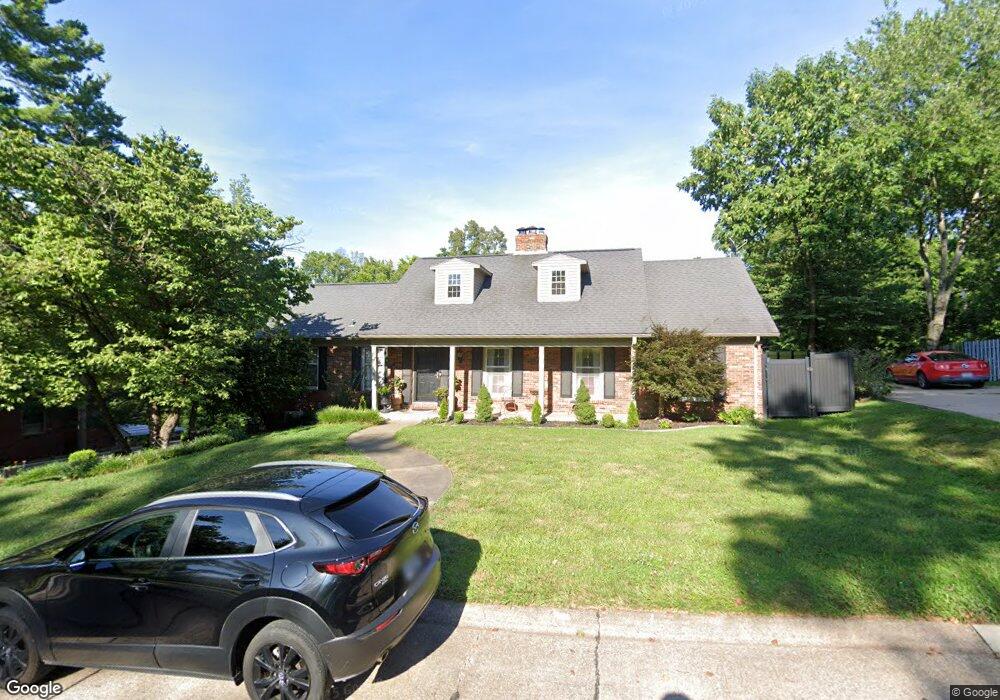
1212 N Henderson Ave Cape Girardeau, MO 63701
Estimated Value: $283,349 - $430,000
2
Beds
3
Baths
3,344
Sq Ft
$109/Sq Ft
Est. Value
About This Home
This home is located at 1212 N Henderson Ave, Cape Girardeau, MO 63701 and is currently estimated at $364,587, approximately $109 per square foot. 1212 N Henderson Ave is a home with nearby schools including Blanchard Elementary School, Central Middle School, and Central Junior High School.
Ownership History
Date
Name
Owned For
Owner Type
Purchase Details
Closed on
Apr 5, 2019
Sold by
Pfeiffer Paul Eugene and Pfeiffer Petriana Lynn
Bought by
Pfeiffer Paul Eugene and Pfeiffer Trust
Current Estimated Value
Purchase Details
Closed on
May 24, 2005
Sold by
Robinson D Mitch and Robinson Debra Cecil
Bought by
Pfeiffer Paul E and Pfeiffer Petrina L
Home Financials for this Owner
Home Financials are based on the most recent Mortgage that was taken out on this home.
Original Mortgage
$175,189
Interest Rate
5.92%
Mortgage Type
FHA
Purchase Details
Closed on
May 12, 2005
Sold by
Robinson D Mitch and Robinson Debra Cecil
Bought by
Pfeiffer Paul E and Pfeiffer Petrina L
Home Financials for this Owner
Home Financials are based on the most recent Mortgage that was taken out on this home.
Original Mortgage
$175,189
Interest Rate
5.92%
Mortgage Type
FHA
Create a Home Valuation Report for This Property
The Home Valuation Report is an in-depth analysis detailing your home's value as well as a comparison with similar homes in the area
Home Values in the Area
Average Home Value in this Area
Purchase History
| Date | Buyer | Sale Price | Title Company |
|---|---|---|---|
| Pfeiffer Paul Eugene | -- | None Available | |
| Pfeiffer Paul E | -- | None Available | |
| Pfeiffer Paul E | -- | None Available |
Source: Public Records
Mortgage History
| Date | Status | Borrower | Loan Amount |
|---|---|---|---|
| Previous Owner | Pfeiffer Paul E | $175,189 | |
| Previous Owner | Pfeiffer Paul E | $175,189 |
Source: Public Records
Tax History Compared to Growth
Tax History
| Year | Tax Paid | Tax Assessment Tax Assessment Total Assessment is a certain percentage of the fair market value that is determined by local assessors to be the total taxable value of land and additions on the property. | Land | Improvement |
|---|---|---|---|---|
| 2025 | $16 | $33,140 | $3,390 | $29,750 |
| 2024 | $16 | $31,570 | $3,230 | $28,340 |
| 2023 | $1,641 | $31,570 | $3,230 | $28,340 |
| 2022 | $1,513 | $29,100 | $2,980 | $26,120 |
| 2021 | $1,513 | $29,100 | $2,980 | $26,120 |
| 2020 | $1,517 | $29,100 | $2,980 | $26,120 |
| 2019 | $1,515 | $29,100 | $0 | $0 |
| 2018 | $1,512 | $29,100 | $0 | $0 |
| 2017 | $1,515 | $29,100 | $0 | $0 |
| 2016 | $1,762 | $33,970 | $0 | $0 |
| 2015 | $1,764 | $33,970 | $0 | $0 |
| 2014 | $1,518 | $29,090 | $0 | $0 |
Source: Public Records
Map
Nearby Homes
- 1427 Price Dr
- 1014 N Henderson Ave
- 1417 Mary Ann St
- 1446 N Henderson St
- 1525 Brucher St
- 1210 Perryville Rd
- 303 Orange Bowl Dr
- 820 Perry Ave
- 242 Orange Bowl Dr
- 1314 Bertling St
- 1742 Dunklin St
- 1801 N West End Blvd
- 1806 Stoddard St
- 1814 Ricardo Dr
- Lot #11 Emerald St
- 1330 N Sprigg St Unit 1
- 381 N Park Ave
- 374 N Park Ave
- 701 Penny Ave
- 1835 Westridge Dr
- 1208 N Henderson Ave
- 1216 N Henderson Ave
- 1215 N Henderson St
- 1206 N Henderson Ave
- 1209 N Henderson Ave
- 1260 Sailer Cir
- 1308 N Henderson St
- 1201 Henderson Ave
- 1200 N Henderson St
- 1263 Sailer Cir
- 1200 Sailer Cir
- 1242 Sailer Cir
- 1230 Sailer Cir
- 1311 N Henderson St
- 1212 Sailer Cir
- 1150 Henderson Ave
- 1410 Price Dr
- 1253 Sailer Cir
- 1317 N Henderson St
- 1135 N Henderson St