NOT LISTED FOR SALE

Estimated Value: $194,000 - $220,000

3 Beds
3 Baths
1,440 Sq Ft
$142/Sq Ft Est. Value

Last Sold June 05, 2012

Last sale price $150,000 $104 Per Sq Ft

Est. 36% increase in value since last sale

Current estimated payment $1,191/month

About This Home

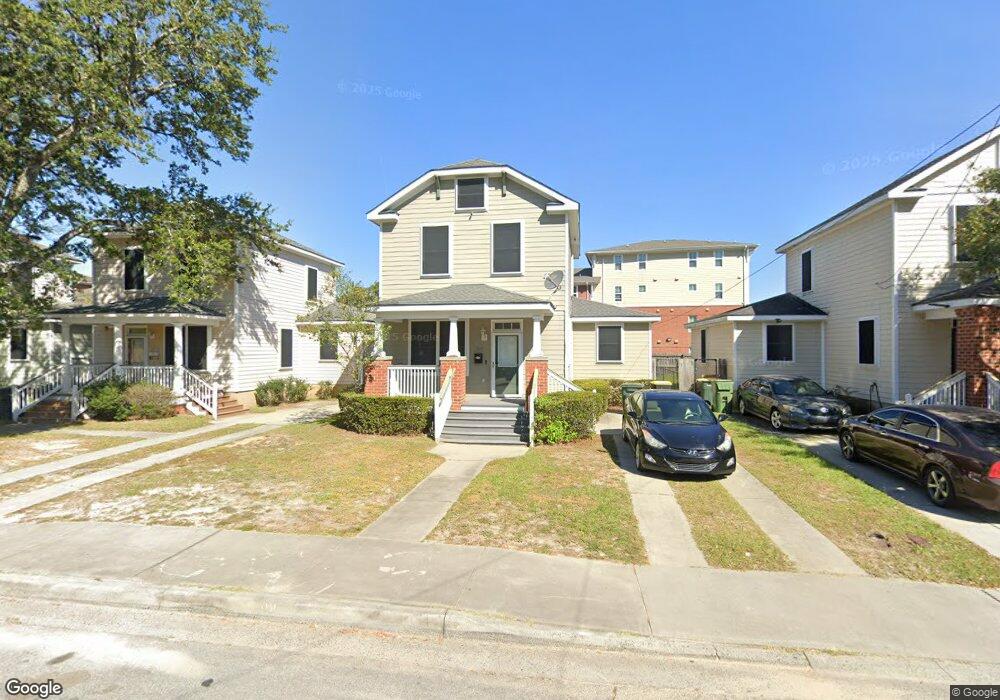
Beautiful Two Story Home In West Savannah! Georgous Hardwood Floors,Fenced Yard, With the Master On the Main Floor! Home Qualifies for $60,000 From the City Of Savannah Dream Maker Program Until October 31st. Don't Miss Out!

Ownership History

Date Name Owned For Owner Type

Purchase Details

Closed on
Jun 5, 2012
Sold by
Chsa Development Inc
Bought by
Clark Marion and Clark Sharonte
Current Estimated Value
$204,729

Home Financials for this Owner

Home Financials are based on the most recent Mortgage that was taken out on this home.
Original Mortgage
$110,450
Outstanding Balance
$76,109
Interest Rate
3.86%
Mortgage Type
New Conventional
Estimated Equity
$128,620

Purchase Details

Closed on
Mar 31, 2011
Sold by
Housing Authority Of Savannah
Bought by
Chsa Development Inc

Home Financials for this Owner

Home Financials are based on the most recent Mortgage that was taken out on this home.
Original Mortgage
$99,500
Interest Rate
4.83%
Mortgage Type
New Conventional
Source: Public Records

Range of Values:

--
Value Increase
--
Percent Increase
--
Adjusted for Inflation
Collateral Analytics

Collateral Analytics Collateral Analytics AVMs (Automated Valuation Model) employ a number of statistical approaches combined with neighborhood-specific comparable selection guarantees the most up-to-date and precise valuations.

Not Available

Collateral Analytics does not have data for the current month. Please view the chart for historical values.

ICE

ICE Mortgage Technology ICE Mortgage Technology’s AVM (Automated Valuation Model) is a state-of-the-art online residential property valuation tool that provides a quick and accurate estimate of the value of almost any home in the U.S.

Not Available

ICE Mortgage Technology does not have data for the current month. Please view the chart for historical values.

First American

First American First American Data & Analytics’ next-generation AVM combines unrivaled data assets with a blended ensemble of valuation models to produce highly accurate, reliable valuations you can trust.

Not Available

First American does not have data for the current month. Please view the chart for historical values.

Quantarium

Quantarium Quantarium’s valuation service, repeatedly proven the industry’s most accurate and comprehensive, is supercharged with a self-learning and auto-tuning AI engine that continually becomes smarter and more accurate as it processes daily inputs from the industry’s leading RE data lake.

Not Available

Quantarium does not have data for the current month. Please view the chart for historical values.

Average Value
Not Available
List Price
Sold Price
Create a Home Valuation Report for This Property
The Home Valuation Report is an in-depth analysis detailing your home's value as well as a comparison with similar homes in the area

Home Values in the Area

Source: Public Records

Average Home Value in this Area


Source: Public Records

Purchase History

Date Buyer Sale Price Title Company
Clark Marion $150,000 --
Chsa Development Inc -- --
Source: Public Records

Mortgage History

Date Status Borrower Loan Amount
Open Clark Marion $110,450
Closed Clark Marion $45,000
Closed Clark Marion $110,450
Previous Owner Chsa Development Inc $99,500
Source: Public Records

Property History

Date Event Price List to Sale Price per Sq Ft Prior Sale
06/05/2012 06/05/12 Sold $150,000 0.0% $104 / Sq Ft View Prior Sale
05/08/2012 05/08/12 Pending -- -- --
08/25/2011 08/25/11 For Sale $150,000 -- $104 / Sq Ft

Tax History Compared to Growth

Source: Public Records

Tax History

Year Tax Paid Tax Assessment Tax Assessment Total Assessment is a certain percentage of the fair market value that is determined by local assessors to be the total taxable value of land and additions on the property. Land Improvement
2025 $1,371 $65,400 $2,400 $63,000
2024 $1,371 $64,800 $2,400 $62,400
2023 $141 $67,560 $2,400 $65,160
2022 $200 $61,280 $2,400 $58,880
2021 $1,343 $52,520 $2,400 $50,120
2020 $1,260 $49,600 $2,400 $47,200
2019 $1,260 $49,600 $2,400 $47,200
2018 $1,243 $47,720 $2,400 $45,320
2017 $1,125 $48,080 $2,400 $45,680
2016 $1,105 $47,480 $2,400 $45,080
2015 $1,102 $47,880 $2,280 $45,600
2014 $2,156 $47,920 $0 $0
Source: Public Records

Agents Affiliated with this Home

  • Section Image
See All Agents

Map