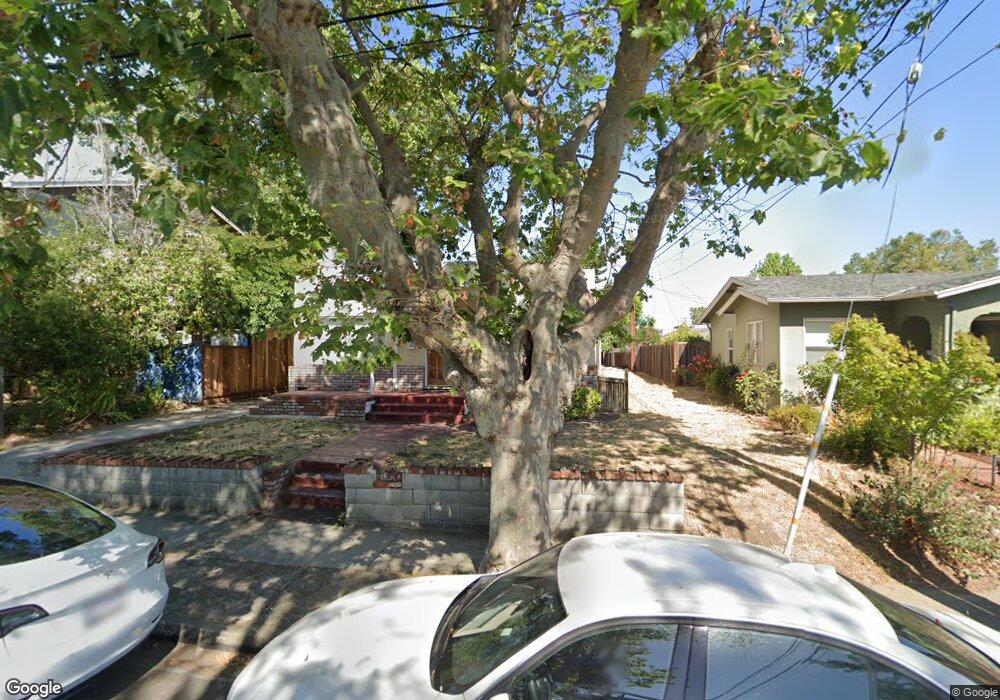
1212 Sanchez Ave Burlingame, CA 94010
Burlingame Terrace NeighborhoodEstimated Value: $2,207,910 - $2,610,000
3
Beds
3
Baths
1,380
Sq Ft
$1,718/Sq Ft
Est. Value
About This Home
This home is located at 1212 Sanchez Ave, Burlingame, CA 94010 and is currently estimated at $2,370,228, approximately $1,717 per square foot. 1212 Sanchez Ave is a home located in San Mateo County with nearby schools including Roosevelt Elementary School, Burlingame Intermediate School, and Burlingame High School.
Ownership History
Date
Name
Owned For
Owner Type
Purchase Details
Closed on
Feb 22, 2002
Sold by
Yu Leo S and Yu Doreen H
Bought by
Yu Leo S
Current Estimated Value
Home Financials for this Owner
Home Financials are based on the most recent Mortgage that was taken out on this home.
Original Mortgage
$584,000
Outstanding Balance
$225,376
Interest Rate
6.12%
Estimated Equity
$2,144,852
Purchase Details
Closed on
May 11, 2000
Sold by
Ratliff Charles B and Ratliff M Y
Bought by
Yu Leo S and Yu Doreen H
Home Financials for this Owner
Home Financials are based on the most recent Mortgage that was taken out on this home.
Original Mortgage
$504,000
Interest Rate
8.87%
Purchase Details
Closed on
Apr 17, 1997
Sold by
Marina Plissak
Bought by
Ratliff Charles B and Ratliff Milena Y
Home Financials for this Owner
Home Financials are based on the most recent Mortgage that was taken out on this home.
Original Mortgage
$308,000
Interest Rate
7.86%
Mortgage Type
Seller Take Back
Create a Home Valuation Report for This Property
The Home Valuation Report is an in-depth analysis detailing your home's value as well as a comparison with similar homes in the area
Home Values in the Area
Average Home Value in this Area
Purchase History
| Date | Buyer | Sale Price | Title Company |
|---|---|---|---|
| Yu Leo S | -- | North American Title Co | |
| Yu Leo S | $650,000 | Fidelity National Title Co | |
| Ratliff Charles B | $320,000 | Chicago Title Insurance Co |
Source: Public Records
Mortgage History
| Date | Status | Borrower | Loan Amount |
|---|---|---|---|
| Open | Yu Leo S | $584,000 | |
| Previous Owner | Yu Leo S | $504,000 | |
| Previous Owner | Ratliff Charles B | $308,000 | |
| Closed | Yu Leo S | $63,000 |
Source: Public Records
Tax History Compared to Growth
Tax History
| Year | Tax Paid | Tax Assessment Tax Assessment Total Assessment is a certain percentage of the fair market value that is determined by local assessors to be the total taxable value of land and additions on the property. | Land | Improvement |
|---|---|---|---|---|
| 2025 | $11,535 | $1,013,784 | $499,508 | $514,276 |
| 2023 | $11,535 | $974,420 | $480,112 | $494,308 |
| 2022 | $11,129 | $955,316 | $470,699 | $484,617 |
| 2021 | $11,143 | $936,586 | $461,470 | $475,116 |
| 2020 | $10,915 | $926,985 | $456,739 | $470,246 |
| 2019 | $10,676 | $908,811 | $447,784 | $461,027 |
| 2018 | $10,475 | $890,992 | $439,004 | $451,988 |
| 2017 | $10,399 | $873,524 | $430,397 | $443,127 |
| 2016 | $10,061 | $856,397 | $421,958 | $434,439 |
| 2015 | $9,973 | $843,534 | $415,620 | $427,914 |
| 2014 | $9,830 | $827,012 | $407,479 | $419,533 |
Source: Public Records
Map
Nearby Homes
- 1315 Carmelita Ave
- 1044 Paloma Ave
- 1111 Laguna Ave
- 1137 Paloma Ave Unit E
- 824 El Camino Real
- 900 Toyon Dr
- 1217 Paloma Ave Unit 3
- 838 Walnut Ave
- 733 Fairfield Rd Unit 8
- 1500 Broadway Unit 205
- 1237 Capuchino Ave Unit 7
- 732 Paloma Ave
- 1300 Paloma Ave
- 1735 Crockett Ln
- 735 El Camino Real Unit 104
- 737 Linden Ave
- 1325 Paloma Ave
- 777 Morrell Ave Unit 302
- 1515 Floribunda Ave Unit 309
- 680 Fairway Cir
- 1208 Sanchez Ave
- 1220 Sanchez Ave
- 1008 Laguna Ave
- 1003 Chula Vista Ave
- 1005 Chula Vista Ave
- 1001 Chula Vista Ave
- 1012 Laguna Ave Unit 1014
- 1007 Chula Vista Ave
- 1215 Sanchez Ave
- 1217 Sanchez Ave
- 1209 Sanchez Ave
- 1221 Sanchez Ave
- 1300 Sanchez Ave
- 1011 Chula Vista Ave
- 1016 Laguna Ave
- 1011 Chula Vista Ave
- 1201 Sanchez Ave
- 1015 Chula Vista Ave
- 1009 Laguna Ave
- 1301 Sanchez Ave