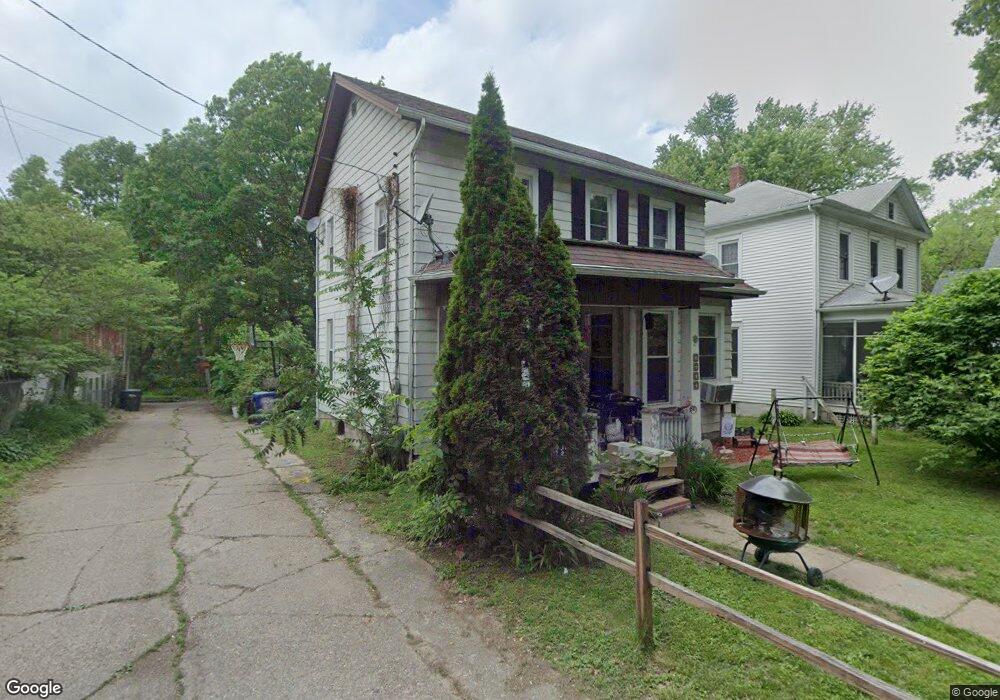
1212 Scott St Davenport, IA 52803
Central Davenport NeighborhoodEstimated Value: $98,000 - $136,000
3
Beds
1
Bath
1,739
Sq Ft
$69/Sq Ft
Est. Value
About This Home
This home is located at 1212 Scott St, Davenport, IA 52803 and is currently estimated at $119,710, approximately $68 per square foot. 1212 Scott St is a home located in Scott County with nearby schools including Walnut Hill Elementary School, Crofton Elementary School, and Casey County Middle School.
Ownership History
Date
Name
Owned For
Owner Type
Purchase Details
Closed on
Feb 2, 2017
Sold by
First Financial Group Lc
Bought by
Murphy Kori A
Current Estimated Value
Purchase Details
Closed on
Feb 18, 2011
Sold by
Aaron Molly
Bought by
Stamper Jessica
Home Financials for this Owner
Home Financials are based on the most recent Mortgage that was taken out on this home.
Original Mortgage
$43,006
Interest Rate
4.93%
Mortgage Type
New Conventional
Purchase Details
Closed on
Apr 1, 2008
Sold by
Osborn Chenoweth Marie A
Bought by
Chenoweth Joseph P
Create a Home Valuation Report for This Property
The Home Valuation Report is an in-depth analysis detailing your home's value as well as a comparison with similar homes in the area
Home Values in the Area
Average Home Value in this Area
Purchase History
| Date | Buyer | Sale Price | Title Company |
|---|---|---|---|
| Murphy Kori A | $12,000 | None Available | |
| Stamper Jessica | $46,000 | None Available | |
| Stamper Jessica | -- | None Available | |
| Chenoweth Joseph P | -- | None Available |
Source: Public Records
Mortgage History
| Date | Status | Borrower | Loan Amount |
|---|---|---|---|
| Previous Owner | Stamper Jessica | $43,006 |
Source: Public Records
Tax History Compared to Growth
Tax History
| Year | Tax Paid | Tax Assessment Tax Assessment Total Assessment is a certain percentage of the fair market value that is determined by local assessors to be the total taxable value of land and additions on the property. | Land | Improvement |
|---|---|---|---|---|
| 2025 | $1,454 | $102,720 | $13,540 | $89,180 |
| 2024 | $1,691 | $91,580 | $13,540 | $78,040 |
| 2023 | $1,475 | $91,580 | $13,540 | $78,040 |
| 2022 | $1,352 | $71,930 | $6,660 | $65,270 |
| 2021 | $1,352 | $71,930 | $6,660 | $65,270 |
| 2020 | $1,549 | $62,080 | $6,660 | $55,420 |
| 2019 | $1,354 | $62,080 | $6,660 | $55,420 |
| 2018 | $1,172 | $62,080 | $6,660 | $55,420 |
| 2017 | $345 | $62,080 | $6,660 | $55,420 |
| 2016 | $1,168 | $62,080 | $0 | $0 |
| 2015 | $1,168 | $58,630 | $0 | $0 |
| 2014 | $1,108 | $58,630 | $0 | $0 |
| 2013 | $1,280 | $0 | $0 | $0 |
| 2012 | -- | $56,600 | $7,560 | $49,040 |
Source: Public Records
Map
Nearby Homes