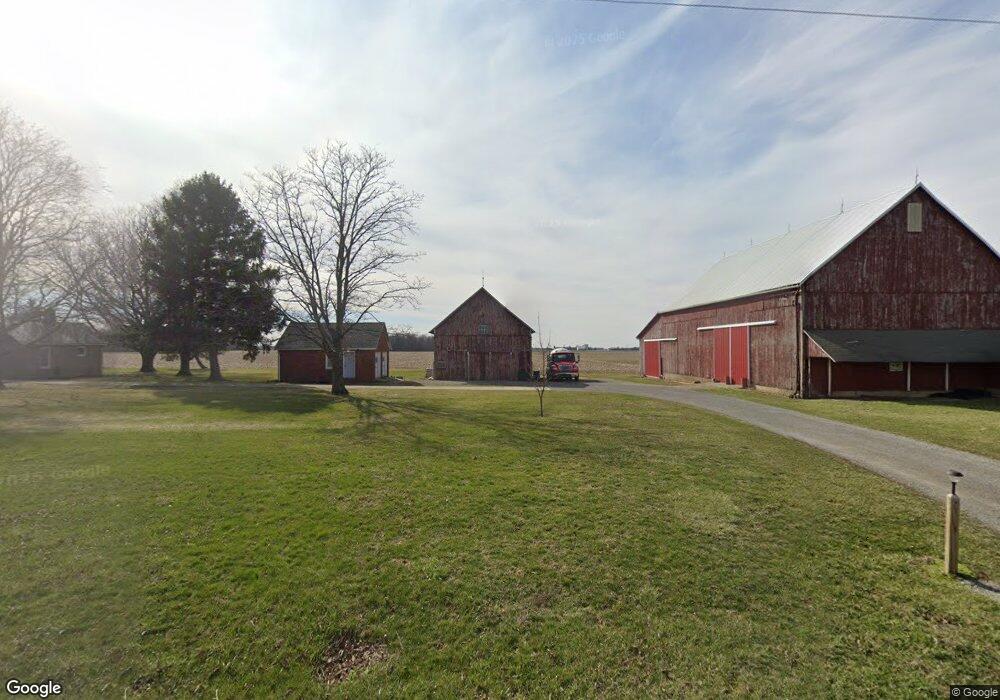
12121 Hancock Rd Bluffton, OH 45817
Estimated Value: $949,798
4
Beds
1
Bath
1,712
Sq Ft
$555/Sq Ft
Est. Value
About This Home
This home is located at 12121 Hancock Rd, Bluffton, OH 45817 and is currently estimated at $949,798, approximately $554 per square foot. 12121 Hancock Rd is a home located in Allen County with nearby schools including Bluffton Elementary School, Bluffton Middle School, and Bluffton High School.
Ownership History
Date
Name
Owned For
Owner Type
Purchase Details
Closed on
Sep 21, 2023
Sold by
Yvonne E Baumgartner Trust and Niswander Steven L
Bought by
Frantz Michael L and Frantz Doreen A
Current Estimated Value
Home Financials for this Owner
Home Financials are based on the most recent Mortgage that was taken out on this home.
Original Mortgage
$400,000
Outstanding Balance
$99,753
Interest Rate
7.09%
Estimated Equity
$850,045
Purchase Details
Closed on
Sep 3, 2020
Sold by
Estate Of Thomas R Niswander
Bought by
Baumgartner Yvonne E and Niswander Steven L
Purchase Details
Closed on
Aug 2, 2012
Sold by
Thurman Jane A Diller
Bought by
Moser David L and Moser Jennifer A
Home Financials for this Owner
Home Financials are based on the most recent Mortgage that was taken out on this home.
Original Mortgage
$179,000
Interest Rate
3.6%
Purchase Details
Closed on
Apr 10, 1990
Bought by
Niswander Leona E
Create a Home Valuation Report for This Property
The Home Valuation Report is an in-depth analysis detailing your home's value as well as a comparison with similar homes in the area
Home Values in the Area
Average Home Value in this Area
Purchase History
| Date | Buyer | Sale Price | Title Company |
|---|---|---|---|
| Frantz Michael L | $800,000 | None Listed On Document | |
| Baumgartner Yvonne E | -- | None Available | |
| Moser David L | $178,200 | Attorney | |
| Niswander Leona E | -- | -- |
Source: Public Records
Mortgage History
| Date | Status | Borrower | Loan Amount |
|---|---|---|---|
| Open | Frantz Michael L | $400,000 | |
| Closed | Frantz Michael L | $400,000 | |
| Previous Owner | Moser David L | $179,000 |
Source: Public Records
Tax History Compared to Growth
Tax History
| Year | Tax Paid | Tax Assessment Tax Assessment Total Assessment is a certain percentage of the fair market value that is determined by local assessors to be the total taxable value of land and additions on the property. | Land | Improvement |
|---|---|---|---|---|
| 2024 | $4,939 | $295,860 | $241,820 | $54,040 |
| 2023 | $3,507 | $217,530 | $177,800 | $39,730 |
| 2022 | $3,397 | $217,530 | $177,800 | $39,730 |
| 2021 | $3,590 | $217,530 | $177,800 | $39,730 |
| 2020 | $4,087 | $184,910 | $151,480 | $33,430 |
| 2019 | $4,087 | $184,910 | $151,480 | $33,430 |
| 2018 | $4,455 | $184,910 | $151,480 | $33,430 |
| 2017 | $4,648 | $166,500 | $138,640 | $27,860 |
| 2016 | $4,648 | $166,500 | $138,640 | $27,860 |
| 2015 | $3,311 | $166,500 | $138,640 | $27,860 |
| 2014 | $3,311 | $125,340 | $95,970 | $29,370 |
| 2013 | $3,086 | $125,340 | $95,970 | $29,370 |
Source: Public Records
Map
Nearby Homes
- 17297 Township Road 51
- 110 Magnolia Ln
- 106 Riley St
- 222 N Lawn Ave
- 210 N Jackson St
- 0 Ohio 103
- 212 S Lawn Ave
- 222 Grove St
- 217 Grove St
- 0 Columbus Grove-Bluffton Rd
- 513 S Jackson St
- 305 Parkview Dr
- 303 Parkview Dr
- 301 Parkview Dr
- 307 Parkview Dr
- 313 Parkview Dr
- 315 Parkview Dr
- 317 Parkview Dr
- 656 S Main St
- 319 Parkview Dr
- 17179 County Road 15
- 11875 Hancock Rd
- 12305 Hancock Rd
- 17886 Road 1
- 17923 County Road 15
- 11999 Snider Rd
- 300 Township Road 35
- 11840 Snider Rd
- 11899 Snider Rd
- 11776 Snider Rd
- 12050 Snider Rd
- 11750 Snider Rd
- 11845 Snider Rd
- 11770 Snider Rd
- 508 County Road 313
- 330 County Road 313
- 513 County Road 313
- 555 County Road 313
- 555 C R 313
- 555 County Rd