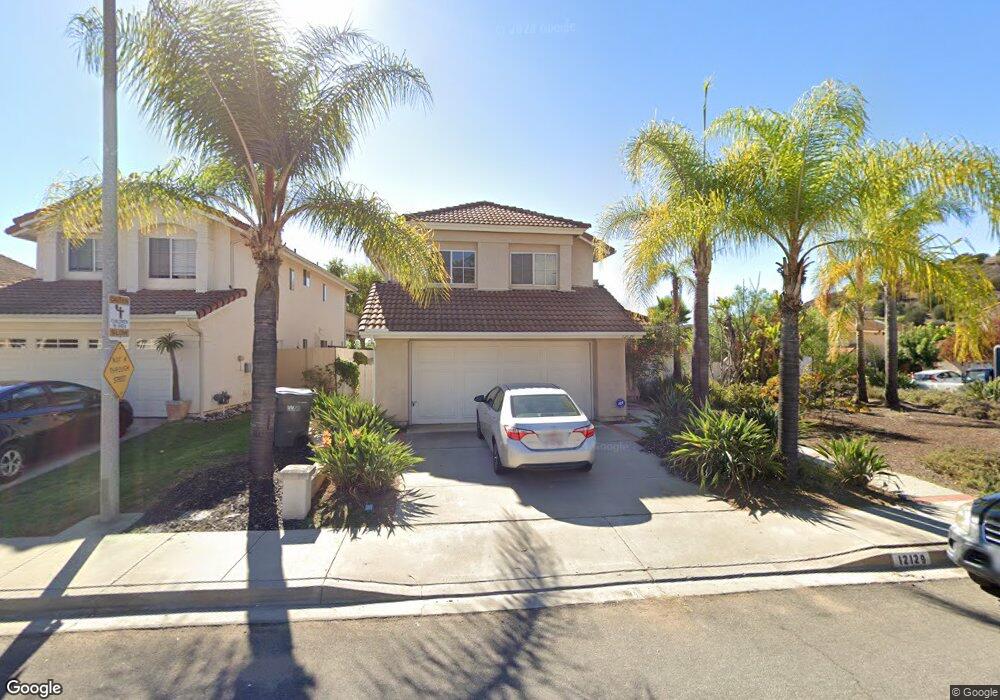
12129 Via Serrano El Cajon, CA 92019
Rancho Park NeighborhoodEstimated Value: $868,000 - $998,000
3
Beds
3
Baths
1,577
Sq Ft
$588/Sq Ft
Est. Value
About This Home
This home is located at 12129 Via Serrano, El Cajon, CA 92019 and is currently estimated at $927,610, approximately $588 per square foot. 12129 Via Serrano is a home located in San Diego County with nearby schools including Rancho San Diego Elementary, Hillsdale Middle School, and Valhalla High.
Ownership History
Date
Name
Owned For
Owner Type
Purchase Details
Closed on
Jun 25, 1999
Sold by
Turck Thomas M and Turck Jennifer E
Bought by
Jamison Robert K and Jamison Deeann
Current Estimated Value
Home Financials for this Owner
Home Financials are based on the most recent Mortgage that was taken out on this home.
Original Mortgage
$192,050
Outstanding Balance
$52,574
Interest Rate
7.51%
Estimated Equity
$875,036
Purchase Details
Closed on
Jul 22, 1997
Sold by
Tenney David Thomas
Bought by
Tenney Karen
Home Financials for this Owner
Home Financials are based on the most recent Mortgage that was taken out on this home.
Original Mortgage
$175,000
Interest Rate
7.7%
Purchase Details
Closed on
Jun 27, 1997
Sold by
Anne Smith Karen and Anne Karen
Bought by
Turck Thomas M and Turck Jennifer E
Home Financials for this Owner
Home Financials are based on the most recent Mortgage that was taken out on this home.
Original Mortgage
$175,000
Interest Rate
7.7%
Purchase Details
Closed on
Nov 1, 1989
Create a Home Valuation Report for This Property
The Home Valuation Report is an in-depth analysis detailing your home's value as well as a comparison with similar homes in the area
Home Values in the Area
Average Home Value in this Area
Purchase History
| Date | Buyer | Sale Price | Title Company |
|---|---|---|---|
| Jamison Robert K | $256,500 | California Title Company | |
| Tenney Karen | -- | Commonwealth Title Co | |
| Turck Thomas M | $194,000 | Commonwealth Land Title Co | |
| -- | $202,300 | -- |
Source: Public Records
Mortgage History
| Date | Status | Borrower | Loan Amount |
|---|---|---|---|
| Open | Jamison Robert K | $192,050 | |
| Previous Owner | Turck Thomas M | $175,000 | |
| Closed | Jamison Robert K | $51,250 |
Source: Public Records
Tax History Compared to Growth
Tax History
| Year | Tax Paid | Tax Assessment Tax Assessment Total Assessment is a certain percentage of the fair market value that is determined by local assessors to be the total taxable value of land and additions on the property. | Land | Improvement |
|---|---|---|---|---|
| 2025 | $5,340 | $393,594 | $174,927 | $218,667 |
| 2024 | $5,340 | $385,878 | $171,498 | $214,380 |
| 2023 | $5,186 | $378,313 | $168,136 | $210,177 |
| 2022 | $5,084 | $370,896 | $164,840 | $206,056 |
| 2021 | $5,027 | $363,624 | $161,608 | $202,016 |
| 2020 | $4,939 | $359,896 | $159,951 | $199,945 |
| 2019 | $4,873 | $352,840 | $156,815 | $196,025 |
| 2018 | $4,752 | $345,923 | $153,741 | $192,182 |
| 2017 | $595 | $339,141 | $150,727 | $188,414 |
| 2016 | $4,454 | $332,492 | $147,772 | $184,720 |
| 2015 | $4,426 | $327,499 | $145,553 | $181,946 |
| 2014 | $4,348 | $321,084 | $142,702 | $178,382 |
Source: Public Records
Map
Nearby Homes
- 11844 Via Granero
- 12063 Via Hacienda
- 11786 Monte View Ct
- 11683 Via Rancho San Diego
- 12034 Calle de Montana Unit 286
- 12045 Calle de Medio Unit 104
- 12020 Calle de Medio Unit 174
- 12319 Via Hacienda
- 11422 Via Rancho San Diego Unit 84
- 11376 Via Rancho San Diego Unit F
- 11368 Via Rancho San Diego Unit E
- 12093 Calle de Medio Unit 131
- 11523 Fury Ln Unit 111
- 11525 Fury Ln Unit 88
- 11517 Fury Ln Unit 56
- 12190 Cuyamaca College Dr E Unit 1100
- 12190 Cuyamaca College Dr E Unit 1009
- 12191 Cuyamaca College Dr E Unit 210
- 12191 Cuyamaca College Dr E Unit 213
- 12191 Cuyamaca College Dr E Unit 110
- 12133 Via Serrano
- 12141 Via Serrano
- 11751 Avenida Anacapa
- 12145 Via Serrano
- 11784 Avenida Anacapa
- 11792 Avenida Anacapa
- 11776 Avenida Anacapa
- 11798 Avenida Anacapa
- 11768 Avenida Anacapa
- 12147 Via Serrano
- 12130 Via Serrano
- 12122 Via Serrano
- 11760 Avenida Anacapa
- 12134 Via Serrano
- 11743 Avenida Anacapa
- 12138 Via Serrano
- 12114 Via Serrano
- 12149 Via Serrano
- 11752 Avenida Anacapa
- 12142 Via Serrano