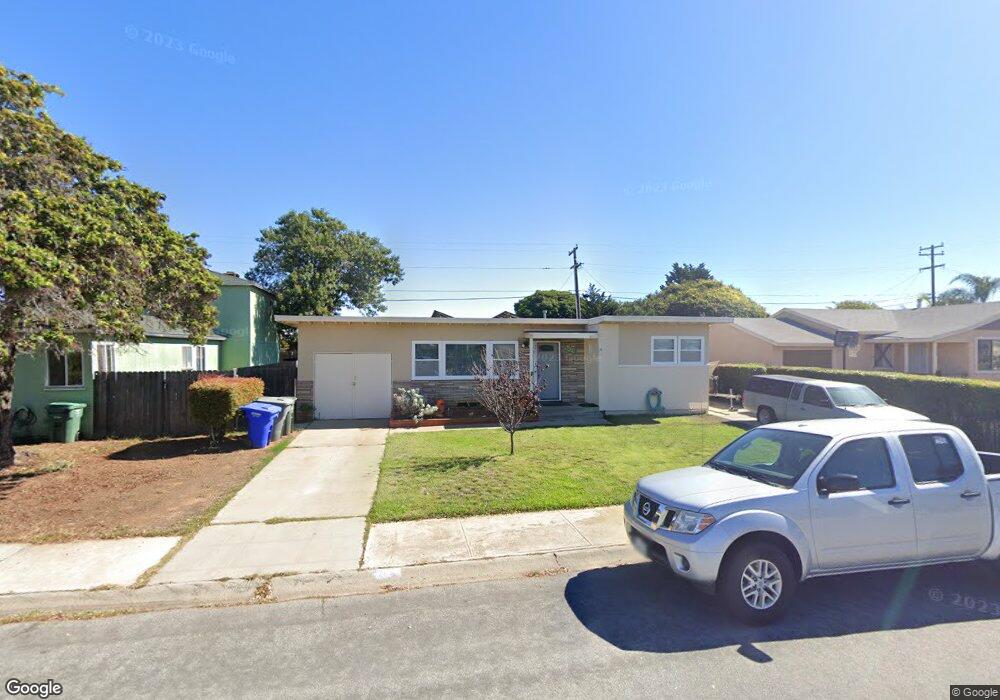
1213 8th St Imperial Beach, CA 91932
Estimated Value: $811,218 - $890,000
3
Beds
1
Bath
1,353
Sq Ft
$627/Sq Ft
Est. Value
About This Home
This home is located at 1213 8th St, Imperial Beach, CA 91932 and is currently estimated at $848,305, approximately $626 per square foot. 1213 8th St is a home located in San Diego County with nearby schools including Oneonta Elementary School, Mar Vista Academy, and Mar Vista Senior High School.
Ownership History
Date
Name
Owned For
Owner Type
Purchase Details
Closed on
Jun 8, 2019
Sold by
Serrano Eli Richard and Serrano Carmen M
Bought by
Serrano Eli Richard and Serrano Carmen M
Current Estimated Value
Purchase Details
Closed on
Feb 23, 1999
Sold by
Serrano Carmen M
Bought by
Serrano Eli and Serrano Carmen M
Home Financials for this Owner
Home Financials are based on the most recent Mortgage that was taken out on this home.
Original Mortgage
$124,200
Outstanding Balance
$29,498
Interest Rate
6.78%
Estimated Equity
$818,807
Purchase Details
Closed on
Nov 14, 1997
Sold by
Eli Serrano
Bought by
Serrano Carmen M
Purchase Details
Closed on
Mar 21, 1994
Sold by
Gregory Kenneth A
Bought by
Serrano Eli and Serrano Carmen M
Home Financials for this Owner
Home Financials are based on the most recent Mortgage that was taken out on this home.
Original Mortgage
$124,058
Interest Rate
7.79%
Mortgage Type
FHA
Create a Home Valuation Report for This Property
The Home Valuation Report is an in-depth analysis detailing your home's value as well as a comparison with similar homes in the area
Home Values in the Area
Average Home Value in this Area
Purchase History
| Date | Buyer | Sale Price | Title Company |
|---|---|---|---|
| Serrano Eli Richard | -- | Services Llc | |
| Serrano Eli | -- | Commonwealth Land Title | |
| Serrano Carmen M | -- | -- | |
| Serrano Eli | $125,000 | First American Title Insuran |
Source: Public Records
Mortgage History
| Date | Status | Borrower | Loan Amount |
|---|---|---|---|
| Open | Serrano Eli | $124,200 | |
| Closed | Serrano Eli | $124,058 |
Source: Public Records
Tax History Compared to Growth
Tax History
| Year | Tax Paid | Tax Assessment Tax Assessment Total Assessment is a certain percentage of the fair market value that is determined by local assessors to be the total taxable value of land and additions on the property. | Land | Improvement |
|---|---|---|---|---|
| 2025 | $3,281 | $216,117 | $98,791 | $117,326 |
| 2024 | $3,281 | $211,880 | $96,854 | $115,026 |
| 2023 | $3,261 | $207,726 | $94,955 | $112,771 |
| 2022 | $3,209 | $203,654 | $93,094 | $110,560 |
| 2021 | $3,322 | $199,662 | $91,269 | $108,393 |
| 2020 | $2,856 | $197,616 | $90,334 | $107,282 |
| 2019 | $2,857 | $193,742 | $88,563 | $105,179 |
| 2018 | $2,801 | $189,944 | $86,827 | $103,117 |
| 2017 | $2,880 | $186,221 | $85,125 | $101,096 |
| 2016 | $2,705 | $182,570 | $83,456 | $99,114 |
| 2015 | $2,654 | $179,829 | $82,203 | $97,626 |
| 2014 | $2,646 | $176,307 | $80,593 | $95,714 |
Source: Public Records
Map
Nearby Homes
- 1226 8th St
- 1211 9th St
- 1149 Connecticut St
- 1236 Emory St
- 765 Elkwood Ave
- 1149, 1149-2 Connecticut St
- 1038 Delaware St
- 1059 Emory St
- 1016 Delaware St
- 718 Oneonta Ave
- 1150-76 11th St
- 981-83 Elder Ave
- 1055 11th St
- 743 Iris Ave
- 800 Emory St
- 843 10th St
- 532 Elm Ave
- 1223 12th St
- 924 Florida St
- 1249 12th St