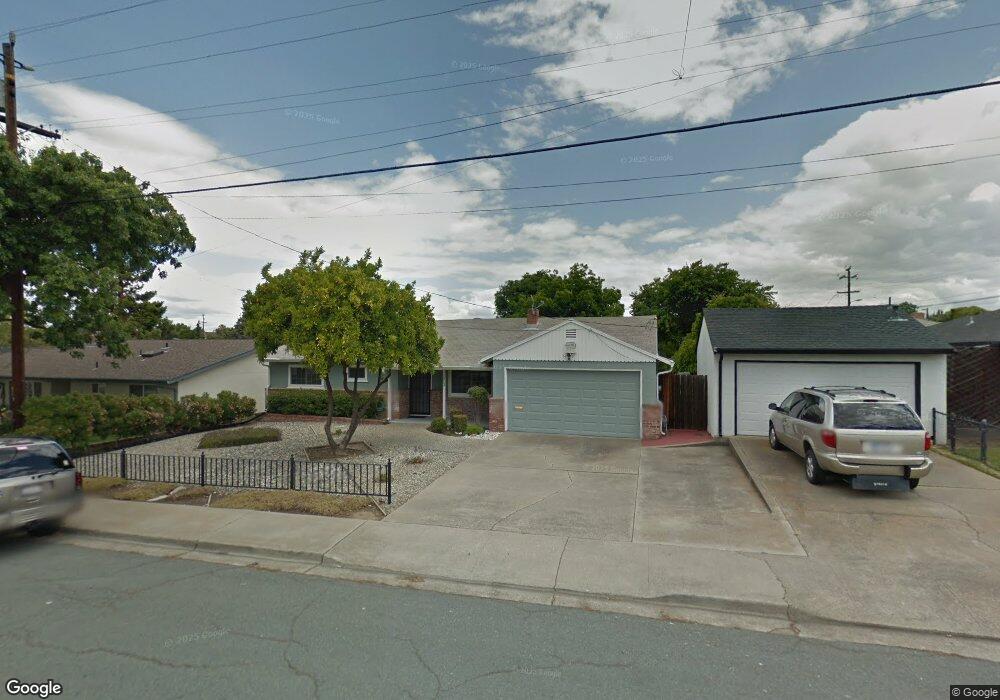
1213 August Way Antioch, CA 94509
North Antioch NeighborhoodEstimated Value: $464,000 - $526,000
3
Beds
1
Bath
1,021
Sq Ft
$474/Sq Ft
Est. Value
About This Home
This home is located at 1213 August Way, Antioch, CA 94509 and is currently estimated at $484,273, approximately $474 per square foot. 1213 August Way is a home located in Contra Costa County with nearby schools including Kimball Elementary School, Antioch Middle School, and Antioch High School.
Ownership History
Date
Name
Owned For
Owner Type
Purchase Details
Closed on
Apr 16, 2019
Sold by
Lois Marie Hernandez 2005 Rev Trust
Bought by
Peterson Rose M
Current Estimated Value
Home Financials for this Owner
Home Financials are based on the most recent Mortgage that was taken out on this home.
Original Mortgage
$353,479
Outstanding Balance
$311,397
Interest Rate
4.4%
Mortgage Type
FHA
Estimated Equity
$172,877
Purchase Details
Closed on
Nov 22, 2005
Sold by
Hernandez Lois
Bought by
Hernandez Lois Marie
Home Financials for this Owner
Home Financials are based on the most recent Mortgage that was taken out on this home.
Original Mortgage
$469,342
Interest Rate
5.86%
Mortgage Type
Reverse Mortgage Home Equity Conversion Mortgage
Create a Home Valuation Report for This Property
The Home Valuation Report is an in-depth analysis detailing your home's value as well as a comparison with similar homes in the area
Home Values in the Area
Average Home Value in this Area
Purchase History
| Date | Buyer | Sale Price | Title Company |
|---|---|---|---|
| Peterson Rose M | $360,000 | First American Title Company | |
| Hernandez Lois Marie | -- | Alliance Title Company |
Source: Public Records
Mortgage History
| Date | Status | Borrower | Loan Amount |
|---|---|---|---|
| Open | Peterson Rose M | $353,479 | |
| Previous Owner | Hernandez Lois Marie | $469,342 |
Source: Public Records
Tax History Compared to Growth
Tax History
| Year | Tax Paid | Tax Assessment Tax Assessment Total Assessment is a certain percentage of the fair market value that is determined by local assessors to be the total taxable value of land and additions on the property. | Land | Improvement |
|---|---|---|---|---|
| 2025 | $4,942 | $401,582 | $206,369 | $195,213 |
| 2024 | $4,815 | $393,709 | $202,323 | $191,386 |
| 2023 | $4,815 | $385,990 | $198,356 | $187,634 |
| 2022 | $4,741 | $378,422 | $194,467 | $183,955 |
| 2021 | $4,555 | $371,003 | $190,654 | $180,349 |
| 2019 | $980 | $53,791 | $20,852 | $32,939 |
| 2018 | $943 | $52,738 | $20,444 | $32,294 |
| 2017 | $909 | $51,705 | $20,044 | $31,661 |
| 2016 | $867 | $50,692 | $19,651 | $31,041 |
| 2015 | $844 | $49,931 | $19,356 | $30,575 |
| 2014 | $811 | $48,954 | $18,977 | $29,977 |
Source: Public Records
Map
Nearby Homes