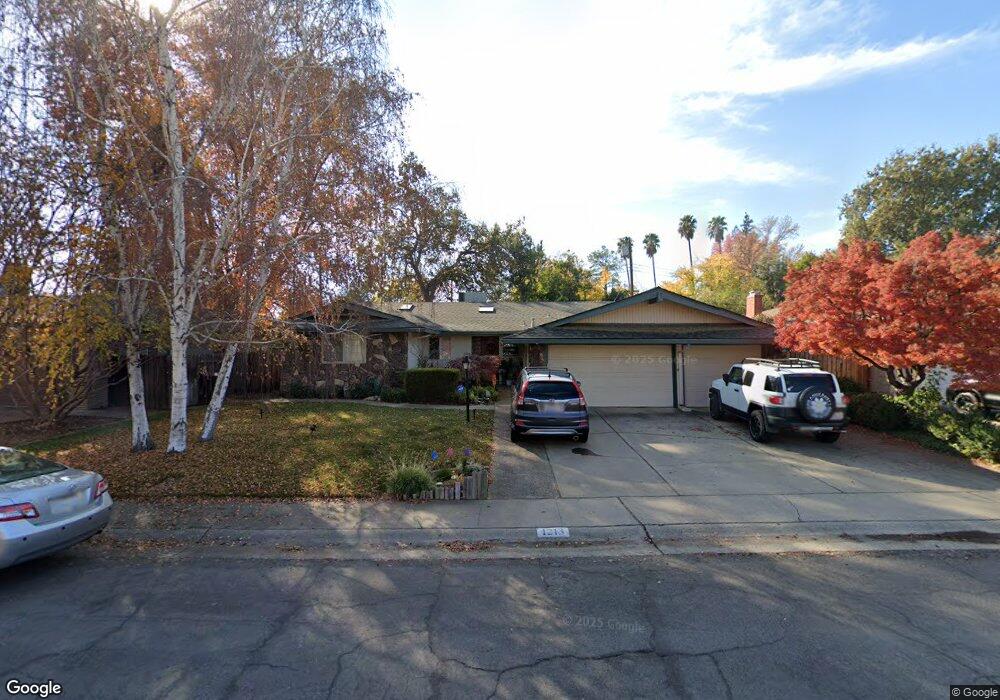
1213 Gary Way Carmichael, CA 95608
Wilhaggin del Dayo NeighborhoodEstimated Value: $780,000 - $815,000
3
Beds
2
Baths
1,780
Sq Ft
$444/Sq Ft
Est. Value
About This Home
This home is located at 1213 Gary Way, Carmichael, CA 95608 and is currently estimated at $789,458, approximately $443 per square foot. 1213 Gary Way is a home located in Sacramento County with nearby schools including Del Dayo Elementary School, Arden Middle School, and Rio Americano High School.
Ownership History
Date
Name
Owned For
Owner Type
Purchase Details
Closed on
Sep 15, 2005
Sold by
Schwandt James E
Bought by
Barnes Jeremy and Barnes Kelly
Current Estimated Value
Home Financials for this Owner
Home Financials are based on the most recent Mortgage that was taken out on this home.
Original Mortgage
$375,000
Outstanding Balance
$194,521
Interest Rate
5.76%
Mortgage Type
Fannie Mae Freddie Mac
Estimated Equity
$594,937
Purchase Details
Closed on
Jan 22, 2003
Sold by
Schwandt James E and Schwandt Catherine R
Bought by
Schwandt James E
Home Financials for this Owner
Home Financials are based on the most recent Mortgage that was taken out on this home.
Original Mortgage
$164,995
Interest Rate
5.96%
Purchase Details
Closed on
Nov 26, 2002
Sold by
Schwandt James E and Schwandt Catherine R
Bought by
Schwandt James E and Schwandt Catherine R
Home Financials for this Owner
Home Financials are based on the most recent Mortgage that was taken out on this home.
Original Mortgage
$164,995
Interest Rate
5.96%
Create a Home Valuation Report for This Property
The Home Valuation Report is an in-depth analysis detailing your home's value as well as a comparison with similar homes in the area
Home Values in the Area
Average Home Value in this Area
Purchase History
| Date | Buyer | Sale Price | Title Company |
|---|---|---|---|
| Barnes Jeremy | $495,000 | Fidelity National Title Co | |
| Schwandt James E | -- | Alliance Title Company | |
| Schwandt James E | -- | -- |
Source: Public Records
Mortgage History
| Date | Status | Borrower | Loan Amount |
|---|---|---|---|
| Open | Barnes Jeremy | $375,000 | |
| Previous Owner | Schwandt James E | $164,995 |
Source: Public Records
Tax History
| Year | Tax Paid | Tax Assessment Tax Assessment Total Assessment is a certain percentage of the fair market value that is determined by local assessors to be the total taxable value of land and additions on the property. | Land | Improvement |
|---|---|---|---|---|
| 2025 | $8,134 | $676,439 | $217,002 | $459,437 |
| 2024 | $8,134 | $663,177 | $212,748 | $450,429 |
| 2023 | $7,930 | $650,175 | $208,577 | $441,598 |
| 2022 | $7,888 | $637,428 | $204,488 | $432,940 |
| 2021 | $7,759 | $624,930 | $200,479 | $424,451 |
| 2020 | $7,319 | $593,821 | $190,500 | $403,321 |
| 2019 | $7,072 | $573,741 | $184,058 | $389,683 |
| 2018 | $6,827 | $551,675 | $176,979 | $374,696 |
| 2017 | $6,544 | $520,449 | $166,962 | $353,487 |
| 2016 | $5,936 | $495,667 | $159,012 | $336,655 |
| 2015 | $5,701 | $476,604 | $152,897 | $323,707 |
| 2014 | $5,531 | $462,723 | $148,444 | $314,279 |
Source: Public Records
Map
Nearby Homes
- 1076 Sand Bar Cir
- 1045 Harrington Way
- 1431 McClaren Dr
- 5021 Jardin Ln
- 1626 Arden Bluffs Ln
- 1230 Jacob Ln
- 1236 Jacob Ln
- 1620 Gary Way
- 4935 Fair Oaks Blvd
- 1744 Haggin Grove Way
- 1625 Gary Way
- 1360 Pars Oak Ln
- 1212 Genesee Ct
- 1749 Haggin Grove Way
- 5216 Marione Dr
- 1574 Barnett Cir
- 1237 Lantern Ct
- 1700 McClaren Dr
- 5312 Retreat Way
- 1835 Westminster Ct
Your Personal Tour Guide
Ask me questions while you tour the home.