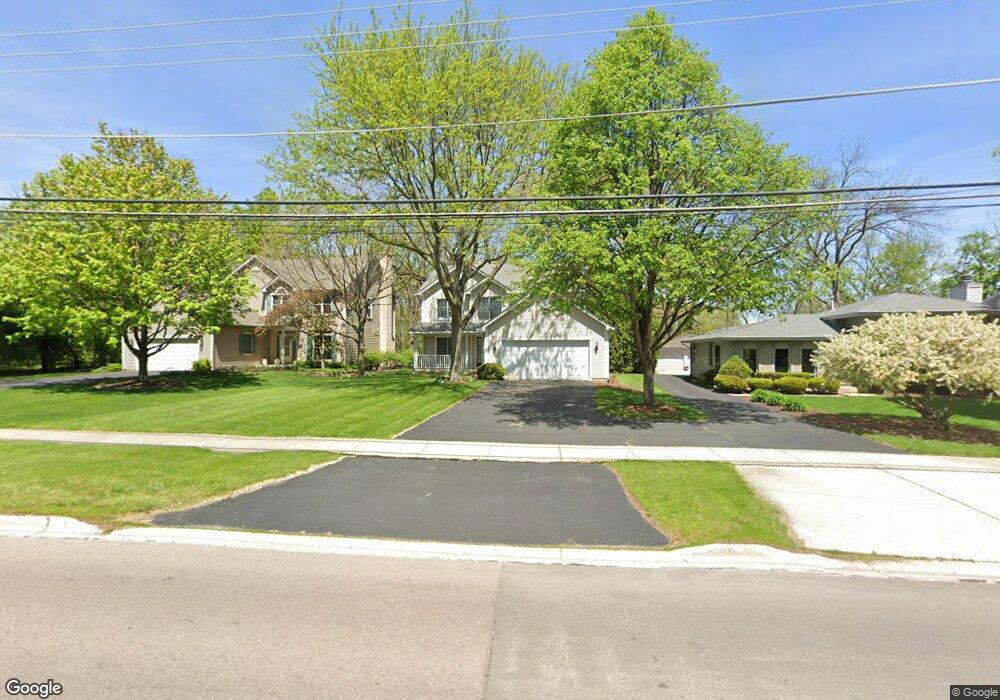
1213 Manchester Rd Wheaton, IL 60187
West Wheaton NeighborhoodEstimated Value: $550,000 - $630,000
4
Beds
2
Baths
2,016
Sq Ft
$290/Sq Ft
Est. Value
About This Home
This home is located at 1213 Manchester Rd, Wheaton, IL 60187 and is currently estimated at $585,246, approximately $290 per square foot. 1213 Manchester Rd is a home located in DuPage County with nearby schools including Clarence E Culver School, Emerson Elementary School, and Monroe Middle School.
Ownership History
Date
Name
Owned For
Owner Type
Purchase Details
Closed on
Jun 14, 2004
Sold by
Najawicz Peter R and Najawicz Julie A
Bought by
Lemmer Michael and Lemmer Theresa
Current Estimated Value
Home Financials for this Owner
Home Financials are based on the most recent Mortgage that was taken out on this home.
Original Mortgage
$225,000
Interest Rate
6.46%
Mortgage Type
Purchase Money Mortgage
Purchase Details
Closed on
Jun 25, 1999
Sold by
Roberts John J
Bought by
Najawicz Peter R and Najawicz Julie A
Home Financials for this Owner
Home Financials are based on the most recent Mortgage that was taken out on this home.
Original Mortgage
$184,000
Interest Rate
6.87%
Purchase Details
Closed on
Jul 13, 1994
Sold by
Suburban Bank Of Elmhurst
Bought by
Roberts John J
Purchase Details
Closed on
Jun 1, 1994
Sold by
Paul Richard
Bought by
Suburban Bank Of Elmhurst
Create a Home Valuation Report for This Property
The Home Valuation Report is an in-depth analysis detailing your home's value as well as a comparison with similar homes in the area
Home Values in the Area
Average Home Value in this Area
Purchase History
| Date | Buyer | Sale Price | Title Company |
|---|---|---|---|
| Lemmer Michael | $375,000 | Ctic | |
| Najawicz Peter R | $232,500 | -- | |
| Roberts John J | $125,000 | -- | |
| Suburban Bank Of Elmhurst | -- | -- |
Source: Public Records
Mortgage History
| Date | Status | Borrower | Loan Amount |
|---|---|---|---|
| Closed | Lemmer Michael | $225,000 | |
| Previous Owner | Najawicz Peter R | $184,000 |
Source: Public Records
Tax History Compared to Growth
Tax History
| Year | Tax Paid | Tax Assessment Tax Assessment Total Assessment is a certain percentage of the fair market value that is determined by local assessors to be the total taxable value of land and additions on the property. | Land | Improvement |
|---|---|---|---|---|
| 2024 | $10,076 | $164,329 | $37,025 | $127,304 |
| 2023 | $9,682 | $151,260 | $34,080 | $117,180 |
| 2022 | $9,466 | $142,680 | $32,210 | $110,470 |
| 2021 | $9,434 | $139,300 | $31,450 | $107,850 |
| 2020 | $9,405 | $138,010 | $31,160 | $106,850 |
| 2019 | $9,190 | $134,370 | $30,340 | $104,030 |
| 2018 | $9,571 | $138,140 | $28,600 | $109,540 |
| 2017 | $9,429 | $133,040 | $27,540 | $105,500 |
| 2016 | $9,304 | $127,730 | $26,440 | $101,290 |
| 2015 | $9,233 | $121,850 | $25,220 | $96,630 |
| 2014 | $7,774 | $101,880 | $18,410 | $83,470 |
| 2013 | $7,574 | $102,180 | $18,460 | $83,720 |
Source: Public Records
Map
Nearby Homes
- 218 N Woodlawn St
- 119 N Dorchester Ave
- 1321 W Liberty Dr
- 505 S Knollwood Dr
- 1222 Champion Forest Ct
- 200 N Erie St
- 0N042 Nepil Ave
- 0S015 Cottonwood Dr
- 921 & 933 N College Ave
- 0N105 Lot 1 Nepil Ave
- 0N105 Lot 2 Nepil Ave
- 418 W Franklin St
- 100 N Gary Ave Unit 304
- 620 Crest St
- 615 Polo Dr
- 127 N West St
- 123 N West St
- 906 W Roosevelt Rd
- 1489 Woodcutter Ln Unit A
- 536 W Evergreen St
- 1207 Manchester Rd
- 1219 Manchester Rd
- 1201 Manchester Rd
- 1119 Manchester Rd
- 1305 Manchester Rd
- 1305 Manchester Rd
- 1208 Manchester Rd
- 1212 Manchester Rd
- 1216 Manchester Rd
- 1204 Manchester Rd
- 1113 Manchester Rd
- 241 N Woodlawn St
- 1118 Manchester Rd
- 1114 Manchester Rd
- 1110 Manchester Rd
- 240 N Woodlawn St
- 231 N Woodlawn St
- 228 N Knollwood Dr
- 237 N Knollwood Dr
- 1106 Manchester Rd