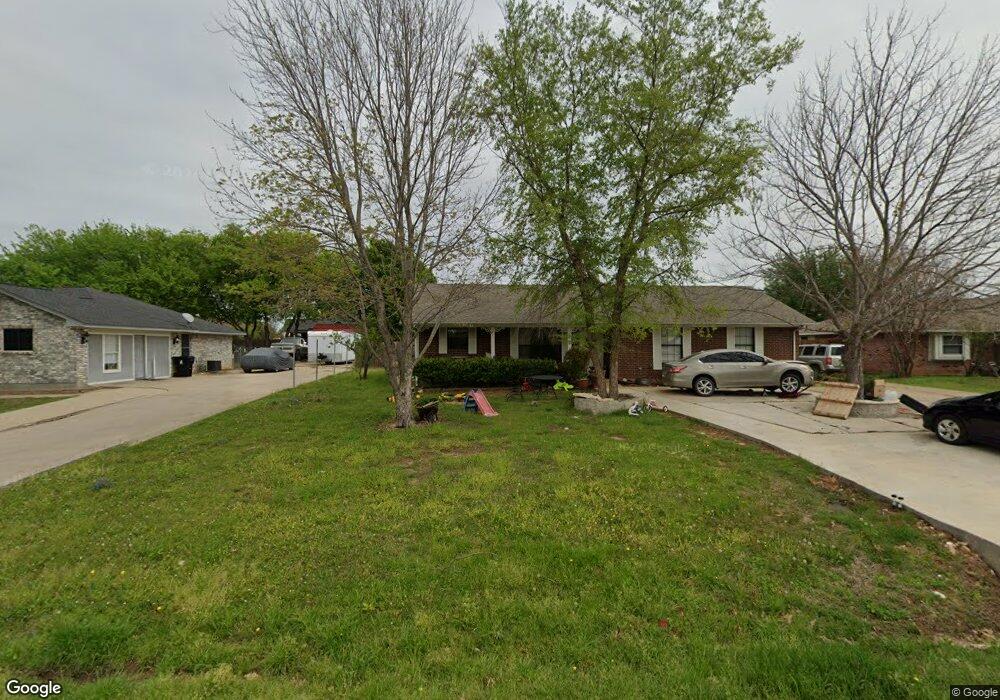
1213 N Saint James Rd Pilot Point, TX 76258
Estimated Value: $320,758 - $356,000
3
Beds
2
Baths
1,586
Sq Ft
$211/Sq Ft
Est. Value
About This Home
This home is located at 1213 N Saint James Rd, Pilot Point, TX 76258 and is currently estimated at $335,190, approximately $211 per square foot. 1213 N Saint James Rd is a home located in Denton County with nearby schools including Pilot Point Early Childhood Center, Pilot Point Elementary School, and Pilot Point Middle School.
Ownership History
Date
Name
Owned For
Owner Type
Purchase Details
Closed on
Dec 3, 2004
Sold by
Goyett Heather M and Goyett Doug
Bought by
Castorena Armando and Castorena Yolanda
Current Estimated Value
Home Financials for this Owner
Home Financials are based on the most recent Mortgage that was taken out on this home.
Original Mortgage
$107,690
Outstanding Balance
$31,870
Interest Rate
6.75%
Mortgage Type
Purchase Money Mortgage
Estimated Equity
$303,320
Purchase Details
Closed on
Mar 22, 2001
Sold by
Hill James E and Hill Mable B
Bought by
Goyett Heather M
Home Financials for this Owner
Home Financials are based on the most recent Mortgage that was taken out on this home.
Original Mortgage
$111,599
Interest Rate
6.98%
Mortgage Type
FHA
Purchase Details
Closed on
Jul 16, 1999
Sold by
Wall Richard and Wall Deborah
Bought by
Hill James E and Hill Mable B
Home Financials for this Owner
Home Financials are based on the most recent Mortgage that was taken out on this home.
Original Mortgage
$66,500
Interest Rate
7.47%
Create a Home Valuation Report for This Property
The Home Valuation Report is an in-depth analysis detailing your home's value as well as a comparison with similar homes in the area
Home Values in the Area
Average Home Value in this Area
Purchase History
| Date | Buyer | Sale Price | Title Company |
|---|---|---|---|
| Castorena Armando | -- | -- | |
| Goyett Heather M | -- | -- | |
| Hill James E | -- | -- |
Source: Public Records
Mortgage History
| Date | Status | Borrower | Loan Amount |
|---|---|---|---|
| Open | Castorena Armando | $107,690 | |
| Previous Owner | Goyett Heather M | $111,599 | |
| Previous Owner | Hill James E | $66,500 |
Source: Public Records
Tax History Compared to Growth
Tax History
| Year | Tax Paid | Tax Assessment Tax Assessment Total Assessment is a certain percentage of the fair market value that is determined by local assessors to be the total taxable value of land and additions on the property. | Land | Improvement |
|---|---|---|---|---|
| 2025 | $4,170 | $318,103 | $81,282 | $258,779 |
| 2024 | $5,206 | $289,185 | $0 | $0 |
| 2023 | $3,853 | $262,895 | $81,282 | $246,658 |
| 2022 | $4,914 | $238,995 | $66,230 | $197,262 |
| 2021 | $4,483 | $238,920 | $66,230 | $172,690 |
| 2020 | $4,104 | $197,516 | $32,513 | $183,416 |
| 2019 | $3,847 | $179,560 | $32,513 | $184,391 |
| 2018 | $3,541 | $163,236 | $29,502 | $157,935 |
| 2017 | $3,229 | $148,396 | $27,696 | $139,248 |
| 2016 | $2,877 | $134,905 | $20,344 | $126,830 |
| 2015 | $2,496 | $122,641 | $20,344 | $102,297 |
| 2013 | -- | $110,772 | $27,741 | $83,031 |
Source: Public Records
Map
Nearby Homes
- 14120 Marion Downs Trail
- 7723 Bent Gale Rd
- 14106 Marion Downs Trail
- 14085 Ladbroke St
- 14073 Ladbroke St
- 14081 Ladbroke St
- 710 Primrose Ln
- 0000 N Washington St
- 600 Acorn St
- 713 E Peel St
- 1702 High Point Dr
- 219 E Evans St
- 127 Morgan St
- 609 Oak St
- 108 Dorothy Ct
- 545 Minnie Ln
- 768 E Northside Dr
- 595 Randys Way
- 638 Minnie Ln
- Hanna Plan at Yarbrough Farms
- 1207 N Saint James Rd
- 1219 N Saint James Rd
- 1212 N Saint James Cir
- 1206 N Saint James Cir
- 1201 N Saint James Rd
- 1218 N Saint James Cir
- 1225 N Saint James Rd
- 1345 N Saint James Rd
- 1200 N Saint James Cir
- 1224 N Saint James Cir
- 1321 N Saint James Rd
- 1360 N Saint James Rd
- 0 Saint James Rd
- 1211 N Saint James Cir
- 1217 N Saint James Cir
- 1109 N Saint James Cir
- 1223 N Saint James Cir
- 1300 N Saint James Cir
- 1324 N Saint James Rd
- 1308 N Saint James Cir