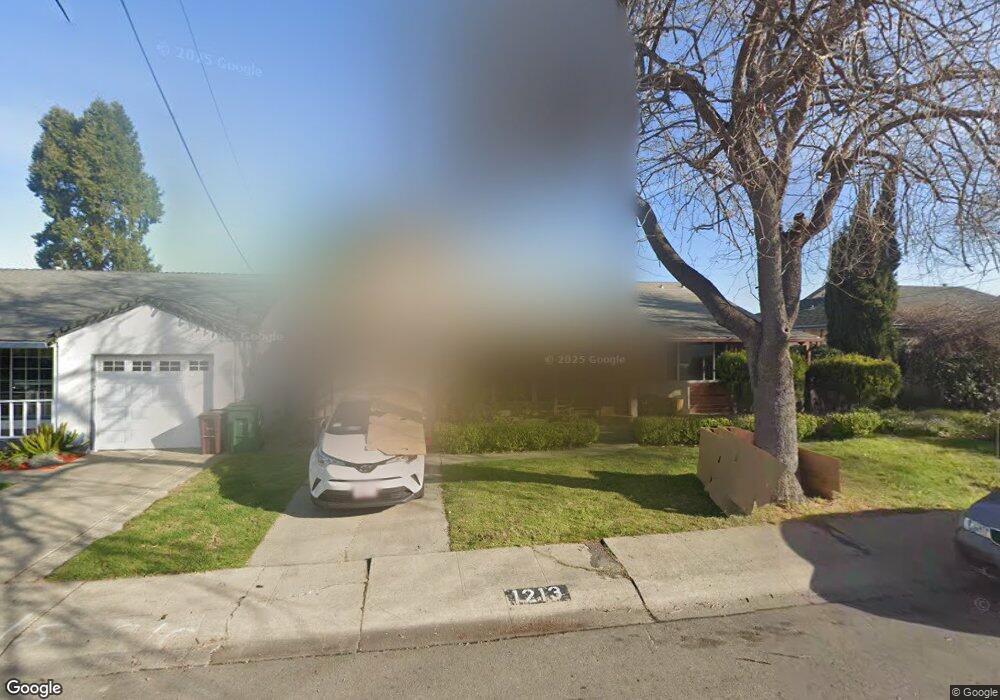
1213 Via Los Trancos San Lorenzo, CA 94580
Estimated Value: $933,000 - $996,000
4
Beds
2
Baths
2,018
Sq Ft
$475/Sq Ft
Est. Value
About This Home
This home is located at 1213 Via Los Trancos, San Lorenzo, CA 94580 and is currently estimated at $957,569, approximately $474 per square foot. 1213 Via Los Trancos is a home located in Alameda County with nearby schools including Del Rey Elementary School, Bohannon Middle School, and Arroyo High School.
Ownership History
Date
Name
Owned For
Owner Type
Purchase Details
Closed on
Aug 8, 2019
Sold by
Wesley Natalie
Bought by
Li Po Lien and Zheng Yunchao
Current Estimated Value
Home Financials for this Owner
Home Financials are based on the most recent Mortgage that was taken out on this home.
Original Mortgage
$588,750
Outstanding Balance
$515,954
Interest Rate
3.73%
Mortgage Type
New Conventional
Estimated Equity
$441,615
Purchase Details
Closed on
Sep 9, 1999
Sold by
Moroney Ruth M
Bought by
Wesley Natalie
Home Financials for this Owner
Home Financials are based on the most recent Mortgage that was taken out on this home.
Original Mortgage
$197,395
Interest Rate
7.89%
Mortgage Type
FHA
Purchase Details
Closed on
Oct 2, 1995
Sold by
Moroney Ruth M
Bought by
Moroney Ruth M
Create a Home Valuation Report for This Property
The Home Valuation Report is an in-depth analysis detailing your home's value as well as a comparison with similar homes in the area
Home Values in the Area
Average Home Value in this Area
Purchase History
| Date | Buyer | Sale Price | Title Company |
|---|---|---|---|
| Li Po Lien | $785,000 | Chicago Title Company | |
| Wesley Natalie | $200,000 | Fidelity National Title Co | |
| Moroney Ruth M | -- | -- |
Source: Public Records
Mortgage History
| Date | Status | Borrower | Loan Amount |
|---|---|---|---|
| Open | Li Po Lien | $588,750 | |
| Previous Owner | Wesley Natalie | $197,395 | |
| Closed | Wesley Natalie | $10,000 |
Source: Public Records
Tax History Compared to Growth
Tax History
| Year | Tax Paid | Tax Assessment Tax Assessment Total Assessment is a certain percentage of the fair market value that is determined by local assessors to be the total taxable value of land and additions on the property. | Land | Improvement |
|---|---|---|---|---|
| 2025 | $10,786 | $858,498 | $257,549 | $600,949 |
| 2024 | $10,786 | $841,668 | $252,500 | $589,168 |
| 2023 | $10,720 | $825,167 | $247,550 | $577,617 |
| 2022 | $10,577 | $808,988 | $242,696 | $566,292 |
| 2021 | $10,297 | $793,131 | $237,939 | $555,192 |
| 2020 | $10,088 | $785,000 | $235,500 | $549,500 |
| 2019 | $6,041 | $443,691 | $82,666 | $361,025 |
| 2018 | $5,702 | $434,993 | $81,045 | $353,948 |
| 2017 | $5,442 | $426,465 | $79,456 | $347,009 |
| 2016 | $5,191 | $418,106 | $77,899 | $340,207 |
| 2015 | $5,077 | $411,827 | $76,729 | $335,098 |
| 2014 | $5,001 | $403,761 | $75,226 | $328,535 |
Source: Public Records
Map
Nearby Homes
- 18005 Sunol Rd
- 17354 Via el Cerrito
- 18003 Incline Place
- 1401 Via Coralla
- 18018 Sahara Rd
- 819 Bockman Rd
- 18251 Via Jose
- 17316 Via Flores
- 17347 Via Encinas
- 1311 Via Manzanas
- 17761 Via Arriba
- 1608 Keller Ave
- 1867 Via Buena Vista
- 19150 Hesperian Blvd Unit 19
- 1575 Via Lucas
- 769 Bartlett Ave
- 16050 Via Olinda
- 16011 Via Conejo
- 1766 Via Redondo
- 19665 Royal Ave
- 1207 Via Los Trancos
- 1219 Via Los Trancos
- 1201 Via Los Trancos
- 1184 Via Esperanza
- 1190 Via Esperanza
- 1178 Via Esperanza
- 1172 Via Esperanza
- 1196 Via Esperanza
- 1193 Via Los Trancos
- 1214 Via Los Trancos
- 17324 Via Alamitos
- 1208 Via Los Trancos
- 1220 Via Los Trancos
- 17316 Via Alamitos
- 1166 Via Esperanza
- 1202 Via Los Trancos
- 1232 Via Los Trancos
- 1187 Via Los Trancos
- 17308 Via Alamitos
- 17348 Via Alamitos