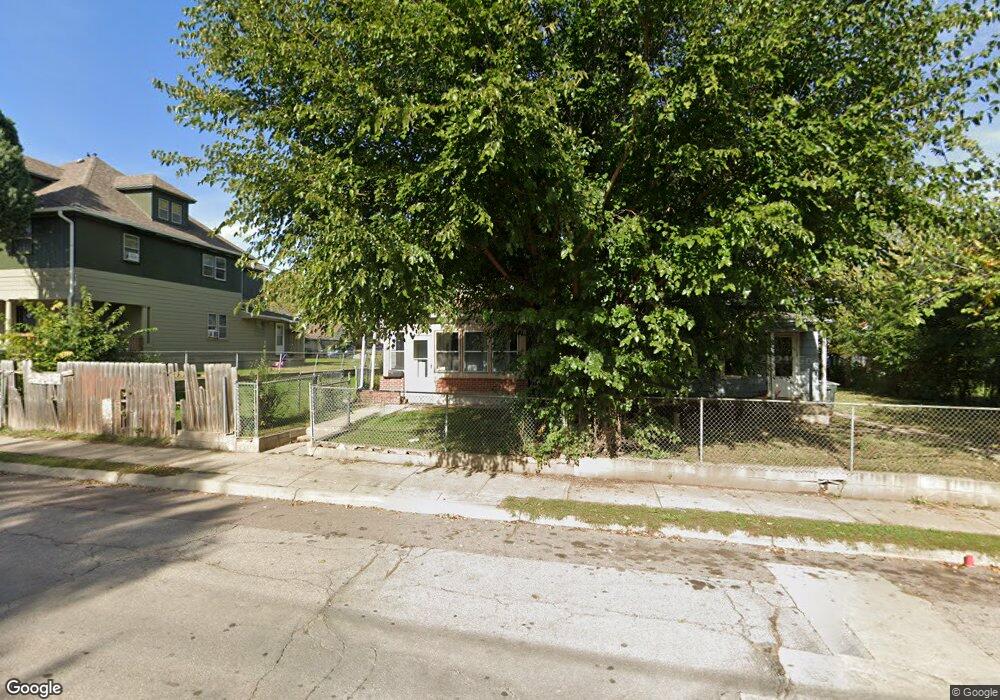
1213 W 3rd St Sioux City, IA 51103
West Side Sioux City NeighborhoodEstimated Value: $90,000 - $137,000
2
Beds
2
Baths
1,114
Sq Ft
$101/Sq Ft
Est. Value
About This Home
This home is located at 1213 W 3rd St, Sioux City, IA 51103 and is currently estimated at $112,862, approximately $101 per square foot. 1213 W 3rd St is a home located in Woodbury County with nearby schools including Loess Hills Elementary School, West Middle School, and West High School.
Ownership History
Date
Name
Owned For
Owner Type
Purchase Details
Closed on
Jul 19, 2022
Sold by
Vargas Angel A and Vargas Marta
Bought by
Villegas Jesus O
Current Estimated Value
Purchase Details
Closed on
Mar 30, 2006
Sold by
Hollingshead John William
Bought by
Villegas Jesus O and Villegas Angel A
Home Financials for this Owner
Home Financials are based on the most recent Mortgage that was taken out on this home.
Original Mortgage
$40,000
Interest Rate
6.38%
Mortgage Type
New Conventional
Create a Home Valuation Report for This Property
The Home Valuation Report is an in-depth analysis detailing your home's value as well as a comparison with similar homes in the area
Home Values in the Area
Average Home Value in this Area
Purchase History
| Date | Buyer | Sale Price | Title Company |
|---|---|---|---|
| Villegas Jesus O | -- | None Listed On Document | |
| Villegas Jesus O | $43,000 | -- |
Source: Public Records
Mortgage History
| Date | Status | Borrower | Loan Amount |
|---|---|---|---|
| Previous Owner | Villegas Jesus O | $40,000 |
Source: Public Records
Tax History Compared to Growth
Tax History
| Year | Tax Paid | Tax Assessment Tax Assessment Total Assessment is a certain percentage of the fair market value that is determined by local assessors to be the total taxable value of land and additions on the property. | Land | Improvement |
|---|---|---|---|---|
| 2025 | $812 | $64,700 | $20,200 | $44,500 |
| 2024 | $812 | $57,200 | $13,800 | $43,400 |
| 2023 | $584 | $57,200 | $13,800 | $43,400 |
| 2022 | $528 | $38,000 | $12,600 | $25,400 |
| 2021 | $528 | $35,700 | $12,600 | $23,100 |
| 2020 | $512 | $33,900 | $9,600 | $24,300 |
| 2019 | $692 | $39,200 | $0 | $0 |
| 2018 | $680 | $39,200 | $0 | $0 |
| 2017 | $614 | $35,600 | $0 | $0 |
| 2016 | $602 | $35,600 | $0 | $0 |
| 2015 | $803 | $35,600 | $6,700 | $28,900 |
| 2014 | $807 | $35,300 | $8,400 | $26,900 |
Source: Public Records
Map
Nearby Homes