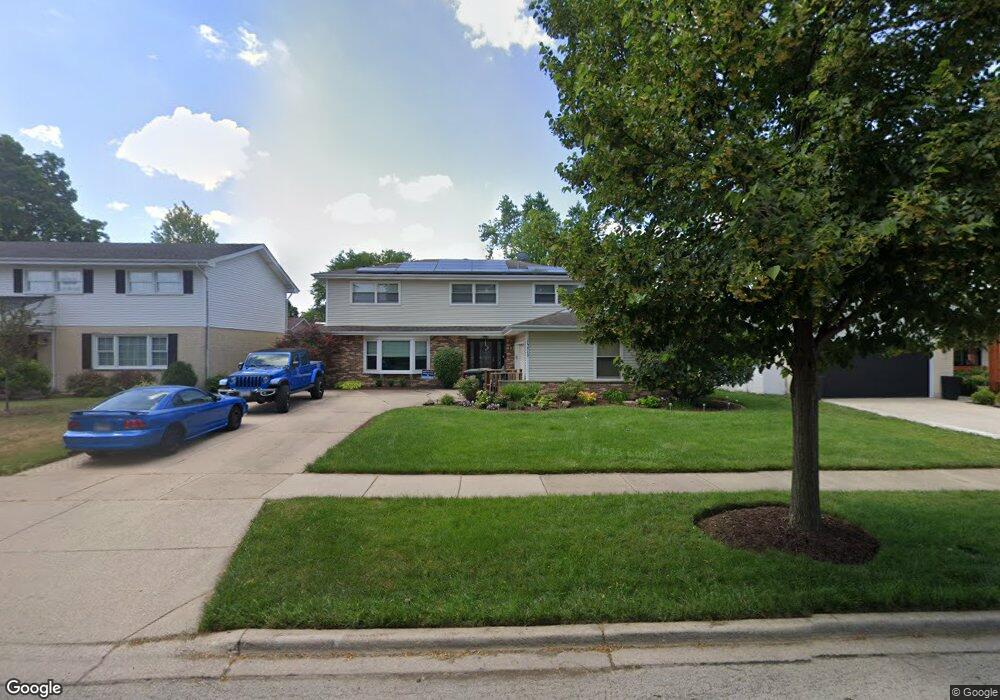
1213 W Green Acres Ln Mount Prospect, IL 60056
Estimated Value: $594,298 - $793,000
4
Beds
3
Baths
2,645
Sq Ft
$259/Sq Ft
Est. Value
About This Home
This home is located at 1213 W Green Acres Ln, Mount Prospect, IL 60056 and is currently estimated at $685,325, approximately $259 per square foot. 1213 W Green Acres Ln is a home located in Cook County with nearby schools including Holmes Jr High School, Forest View Elementary School, and Prospect High School.
Ownership History
Date
Name
Owned For
Owner Type
Purchase Details
Closed on
Sep 18, 2009
Sold by
Guard Tracy L and Jung Sandy A
Bought by
Tielbur Dean and Tielbur Elizabeth
Current Estimated Value
Home Financials for this Owner
Home Financials are based on the most recent Mortgage that was taken out on this home.
Original Mortgage
$414,000
Outstanding Balance
$273,356
Interest Rate
5.38%
Mortgage Type
New Conventional
Estimated Equity
$411,969
Purchase Details
Closed on
Jul 20, 2004
Sold by
Rohn Richard T and Rohn Janet R
Bought by
Guard Tracy L and Guard Sandy A
Home Financials for this Owner
Home Financials are based on the most recent Mortgage that was taken out on this home.
Original Mortgage
$373,600
Interest Rate
5.5%
Mortgage Type
Unknown
Purchase Details
Closed on
Dec 12, 1995
Sold by
Rohn Richard T and Rohn Janet R
Bought by
Rohn Richard T and Rohn Janet R
Create a Home Valuation Report for This Property
The Home Valuation Report is an in-depth analysis detailing your home's value as well as a comparison with similar homes in the area
Home Values in the Area
Average Home Value in this Area
Purchase History
| Date | Buyer | Sale Price | Title Company |
|---|---|---|---|
| Tielbur Dean | $460,000 | None Available | |
| Guard Tracy L | $467,000 | -- | |
| Rohn Richard T | -- | -- |
Source: Public Records
Mortgage History
| Date | Status | Borrower | Loan Amount |
|---|---|---|---|
| Open | Tielbur Dean | $414,000 | |
| Previous Owner | Guard Tracy L | $373,600 | |
| Closed | Guard Tracy L | $70,050 |
Source: Public Records
Tax History Compared to Growth
Tax History
| Year | Tax Paid | Tax Assessment Tax Assessment Total Assessment is a certain percentage of the fair market value that is determined by local assessors to be the total taxable value of land and additions on the property. | Land | Improvement |
|---|---|---|---|---|
| 2024 | $10,193 | $42,438 | $8,450 | $33,988 |
| 2023 | $10,653 | $46,000 | $8,450 | $37,550 |
| 2022 | $10,653 | $46,000 | $8,450 | $37,550 |
| 2021 | $10,201 | $39,031 | $5,492 | $33,539 |
| 2020 | $9,991 | $39,031 | $5,492 | $33,539 |
| 2019 | $10,093 | $43,368 | $5,492 | $37,876 |
| 2018 | $12,902 | $48,626 | $4,647 | $43,979 |
| 2017 | $12,957 | $48,626 | $4,647 | $43,979 |
| 2016 | $12,420 | $48,626 | $4,647 | $43,979 |
| 2015 | $11,654 | $42,989 | $3,802 | $39,187 |
| 2014 | $11,478 | $42,989 | $3,802 | $39,187 |
| 2013 | $11,193 | $42,989 | $3,802 | $39,187 |
Source: Public Records
Map
Nearby Homes
- 1200 W Palm Dr
- 904 S Edgewood Ln
- 708 S Edgewood Ln
- 909 S We go Trail
- 905 W Palm Dr
- 1602 W Willow Ln
- 1000 W Eva Ln
- 512 S Busse Rd
- 1109 S Lavergne Dr
- 816 W Partridge Ln Unit 59
- 1410 S Cypress Dr
- 1024 S Hunt Club Dr
- 506 S Busse Rd
- 1721 W Catalpa Ln
- 1416 S Robert Dr
- 1330 S Mallard Ln Unit 33
- 1316 S Quail Walk Unit 4
- 808 S Deborah Ln
- 1429 S Busse Rd
- 502 W Huntington Commons Rd Unit 443
- 1211 W Green Acres Ln
- 1215 W Green Acres Ln
- 1209 W Green Acres Ln
- 1214 W Glenn Ln
- 1216 W Glenn Ln
- 1217 W Green Acres Ln
- 1218 W Glenn Ln
- 1207 W Green Acres Ln
- 1214 W Green Acres Ln
- 1219 W Green Acres Ln
- 1210 W Glenn Ln
- 1212 W Green Acres Ln
- 1216 W Green Acres Ln
- 1220 W Glenn Ln
- 1210 W Green Acres Ln
- 1218 W Green Acres Ln
- 1205 W Green Acres Ln
- 1208 W Glenn Ln
- 1221 W Green Acres Ln
- 1208 W Green Acres Ln