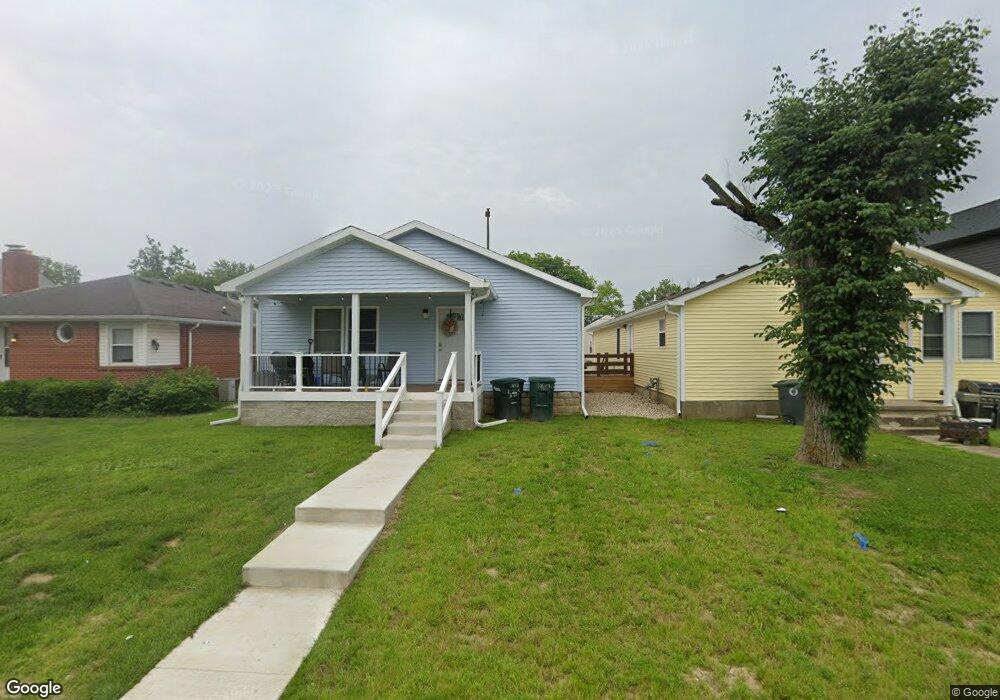
1213 W Rex St Muncie, IN 47303
Riverside-Normal City NeighborhoodEstimated Value: $104,000 - $128,000
2
Beds
5
Baths
1,920
Sq Ft
$60/Sq Ft
Est. Value
About This Home
This home is located at 1213 W Rex St, Muncie, IN 47303 and is currently estimated at $114,667, approximately $59 per square foot. 1213 W Rex St is a home located in Delaware County with nearby schools including Muncie Central High School, West View Elementary School, and Northside Middle School.
Ownership History
Date
Name
Owned For
Owner Type
Purchase Details
Closed on
Sep 27, 2023
Sold by
Checkmate Goh Llc
Bought by
M M Investment 3 Llc
Current Estimated Value
Home Financials for this Owner
Home Financials are based on the most recent Mortgage that was taken out on this home.
Original Mortgage
$329,250
Outstanding Balance
$312,232
Interest Rate
7.23%
Mortgage Type
Purchase Money Mortgage
Estimated Equity
-$197,565
Purchase Details
Closed on
Nov 21, 2022
Sold by
Schmaltz Stephen B
Bought by
Checkmate Goh Llc
Home Financials for this Owner
Home Financials are based on the most recent Mortgage that was taken out on this home.
Original Mortgage
$105,750
Interest Rate
6.95%
Mortgage Type
Credit Line Revolving
Purchase Details
Closed on
Jun 29, 2021
Sold by
Buroker Teresa R
Bought by
Schmaltz Stephen B
Create a Home Valuation Report for This Property
The Home Valuation Report is an in-depth analysis detailing your home's value as well as a comparison with similar homes in the area
Home Values in the Area
Average Home Value in this Area
Purchase History
| Date | Buyer | Sale Price | Title Company |
|---|---|---|---|
| M M Investment 3 Llc | -- | None Listed On Document | |
| Checkmate Goh Llc | -- | None Listed On Document | |
| Checkmate Goh Llc | -- | Youngs Title | |
| Schmaltz Stephen B | -- | None Available |
Source: Public Records
Mortgage History
| Date | Status | Borrower | Loan Amount |
|---|---|---|---|
| Open | M M Investment 3 Llc | $329,250 | |
| Previous Owner | Checkmate Goh Llc | $105,750 |
Source: Public Records
Tax History
| Year | Tax Paid | Tax Assessment Tax Assessment Total Assessment is a certain percentage of the fair market value that is determined by local assessors to be the total taxable value of land and additions on the property. | Land | Improvement |
|---|---|---|---|---|
| 2025 | $1,612 | $239,300 | $15,400 | $223,900 |
| 2024 | $1,612 | $74,700 | $15,400 | $59,300 |
| 2023 | $1,788 | $83,500 | $12,900 | $70,600 |
| 2022 | $1,618 | $75,000 | $12,900 | $62,100 |
| 2021 | $1,484 | $68,300 | $11,700 | $56,600 |
| 2020 | $1,274 | $57,800 | $10,600 | $47,200 |
| 2019 | $1,246 | $56,400 | $10,600 | $45,800 |
| 2018 | $1,220 | $55,100 | $10,600 | $44,500 |
| 2017 | $1,228 | $55,500 | $10,700 | $44,800 |
| 2016 | $1,176 | $52,900 | $10,200 | $42,700 |
| 2014 | $967 | $45,700 | $9,700 | $36,000 |
| 2013 | -- | $45,400 | $9,700 | $35,700 |
Source: Public Records
Map
Nearby Homes
- 1623 N Janney Ave
- 1520 N Wheeling Ave
- 800 W Wills St
- 2000 N Rosewood Ave
- 2300 N Ball Ave
- 3900 W Cowing Dr
- 1300 W University Ave
- 1804 N Milton St
- 709 W Riverside Ave
- 1117 W Haines Ave
- 321 W Weber Dr
- 709 N Wheeling Ave
- 1505 N Elizabeth Ave
- 210 E Ward Ave
- 817 N Mulberry St
- 208 N Meeks Ave
- 304 E Highland Ave
- 202 E Maple St
- 907 W Main St
- 216 S Dill St
Your Personal Tour Guide
Ask me questions while you tour the home.