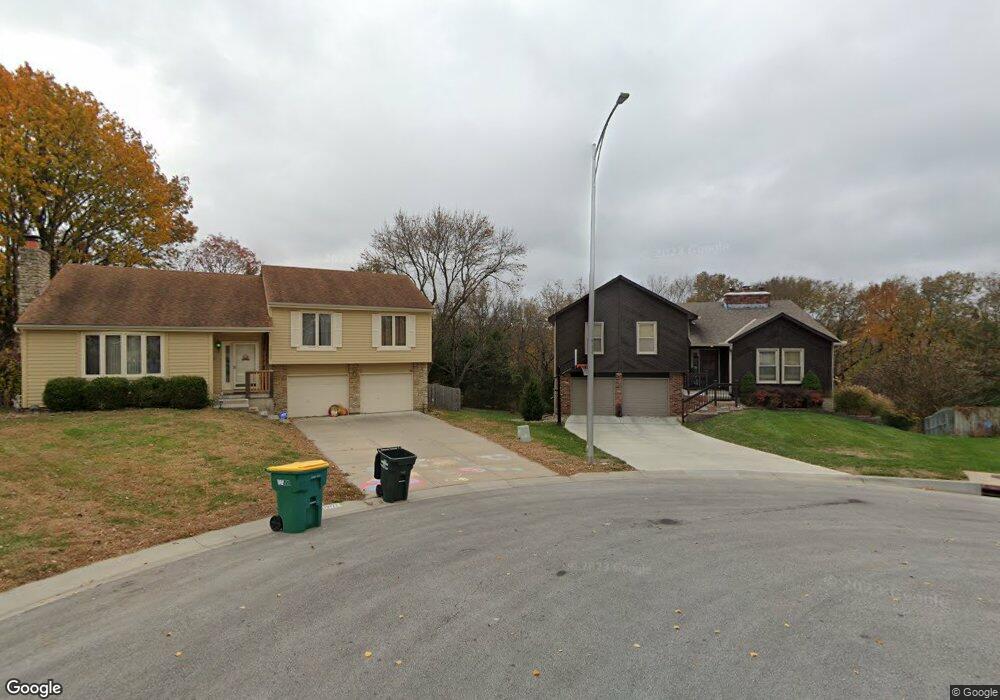
12131 W 48th Terrace Shawnee, KS 66216
Estimated Value: $336,000 - $352,058
3
Beds
2
Baths
1,287
Sq Ft
$268/Sq Ft
Est. Value
About This Home
This home is located at 12131 W 48th Terrace, Shawnee, KS 66216 and is currently estimated at $345,015, approximately $268 per square foot. 12131 W 48th Terrace is a home located in Johnson County with nearby schools including Bluejacket / Flint Elementary, Hocker Grove Middle School, and Shawnee Mission North High School.
Ownership History
Date
Name
Owned For
Owner Type
Purchase Details
Closed on
Feb 5, 2005
Sold by
Springfield Anthony L
Bought by
Springfield Anthony L and Espinoza Connie
Current Estimated Value
Purchase Details
Closed on
Aug 6, 2003
Sold by
Werly Robert H and Werly Kathleen A
Bought by
Springfield Anthony L
Home Financials for this Owner
Home Financials are based on the most recent Mortgage that was taken out on this home.
Original Mortgage
$152,500
Outstanding Balance
$66,617
Interest Rate
5.51%
Mortgage Type
Purchase Money Mortgage
Estimated Equity
$278,398
Create a Home Valuation Report for This Property
The Home Valuation Report is an in-depth analysis detailing your home's value as well as a comparison with similar homes in the area
Home Values in the Area
Average Home Value in this Area
Purchase History
| Date | Buyer | Sale Price | Title Company |
|---|---|---|---|
| Springfield Anthony L | -- | Platinum Title Llc | |
| Springfield Anthony L | -- | Security Land Title Company |
Source: Public Records
Mortgage History
| Date | Status | Borrower | Loan Amount |
|---|---|---|---|
| Open | Springfield Anthony L | $152,500 |
Source: Public Records
Tax History Compared to Growth
Tax History
| Year | Tax Paid | Tax Assessment Tax Assessment Total Assessment is a certain percentage of the fair market value that is determined by local assessors to be the total taxable value of land and additions on the property. | Land | Improvement |
|---|---|---|---|---|
| 2024 | $3,875 | $36,696 | $9,507 | $27,189 |
| 2023 | $3,766 | $35,144 | $8,640 | $26,504 |
| 2022 | $3,284 | $30,545 | $7,855 | $22,690 |
| 2021 | $3,190 | $27,795 | $6,824 | $20,971 |
| 2020 | $2,834 | $24,346 | $6,202 | $18,144 |
| 2019 | $2,741 | $23,529 | $5,920 | $17,609 |
| 2018 | $2,685 | $22,954 | $5,920 | $17,034 |
| 2017 | $2,552 | $21,471 | $5,380 | $16,091 |
| 2016 | $2,567 | $21,333 | $5,380 | $15,953 |
| 2015 | $2,380 | $20,574 | $5,380 | $15,194 |
| 2013 | -- | $18,734 | $5,380 | $13,354 |
Source: Public Records
Map
Nearby Homes
- 11907 W 49th Place
- 12023 W 48th St
- W 48th St
- 13130 W 52nd Terrace
- 13126 W 52nd Terrace
- 13134 W 52nd Terrace
- 13305 W 51st St
- 5013 Bradshaw St
- 5021 Bradshaw St
- 11815 W 53rd St
- 11403 W 51st Terrace
- 5407 Halsey St
- 5504 Monrovia St
- 5308 Mcanany Dr
- 12508 W 56th St
- 6804 Woodend Ave
- 6115 Oak Grove Rd
- 5507 Noland Rd
- 10511 W 49th Place
- 11002 W 55th Terrace
- 12130 W 48th Terrace
- 12127 W 48th Terrace
- 12126 W 48th Terrace
- 12123 W 48th Terrace
- 12119 W 48th Terrace
- 12122 W 48th Terrace
- 4932 Halsey St
- 12113 W 48th Terrace
- 12118 W 48th Terrace
- 4908 Halsey St
- 4914 Halsey St
- 4928 Halsey St
- 4902 Halsey St
- 12107 W 48th Terrace
- 12114 W 48th Terrace
- 4940 Halsey St
- 12123 W 48th St
- 12110 W 48th Terrace
- 12103 W 48th Terrace
- 4946 Halsey St