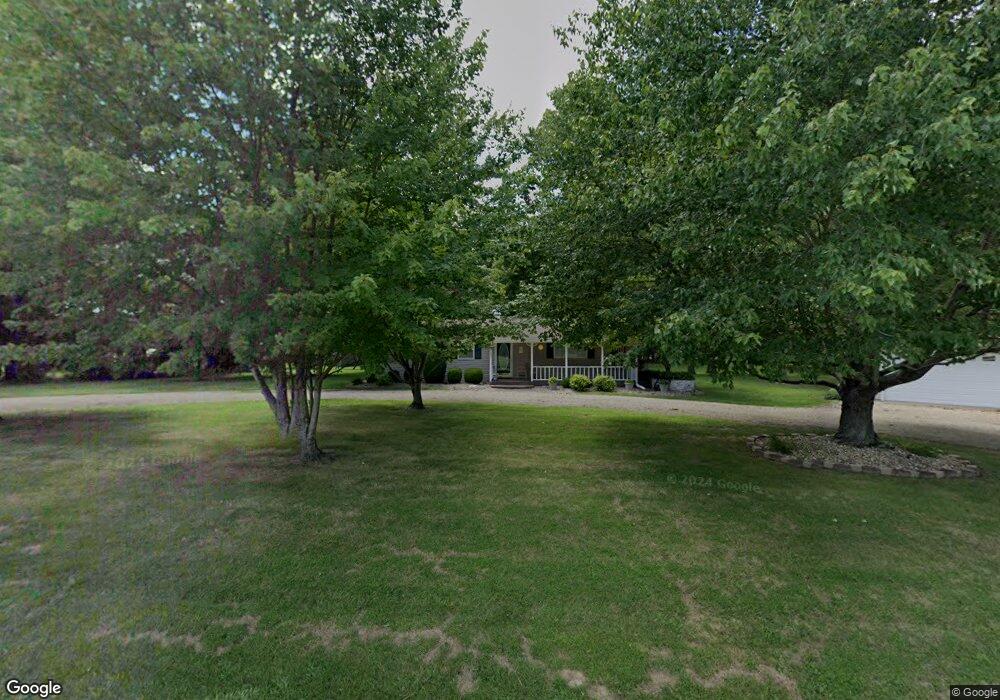
12137 N 1000th Rd Effingham, IL 62401
Estimated Value: $173,034 - $647,000
1
Bed
--
Bath
1,272
Sq Ft
$237/Sq Ft
Est. Value
About This Home
This home is located at 12137 N 1000th Rd, Effingham, IL 62401 and is currently estimated at $301,009, approximately $236 per square foot. 12137 N 1000th Rd is a home with nearby schools including South Side Grade School, Early Learning Center, and Central Grade School.
Ownership History
Date
Name
Owned For
Owner Type
Purchase Details
Closed on
Oct 9, 2024
Sold by
Watson Catherine M
Bought by
Catherine M Watson Trust and Watson
Current Estimated Value
Purchase Details
Closed on
Nov 10, 2015
Sold by
Watson Catherine M
Bought by
Watson Catherine M and The Catherine M Watson Trust
Purchase Details
Closed on
Nov 15, 2005
Sold by
Lewis Helen R and Bridges Helen E
Bought by
Watson Catherinc M
Home Financials for this Owner
Home Financials are based on the most recent Mortgage that was taken out on this home.
Original Mortgage
$51,000
Interest Rate
5.89%
Mortgage Type
New Conventional
Purchase Details
Closed on
Oct 21, 2005
Sold by
Dyer Patsy R
Bought by
Watson Catherine M
Home Financials for this Owner
Home Financials are based on the most recent Mortgage that was taken out on this home.
Original Mortgage
$51,000
Interest Rate
5.89%
Mortgage Type
New Conventional
Create a Home Valuation Report for This Property
The Home Valuation Report is an in-depth analysis detailing your home's value as well as a comparison with similar homes in the area
Purchase History
| Date | Buyer | Sale Price | Title Company |
|---|---|---|---|
| Catherine M Watson Trust | -- | None Listed On Document | |
| Watson Catherine M | -- | None Available | |
| Watson Catherinc M | -- | None Available | |
| Watson Catherine M | $91,000 | None Available |
Source: Public Records
Mortgage History
| Date | Status | Borrower | Loan Amount |
|---|---|---|---|
| Previous Owner | Watson Catherine M | $51,000 |
Source: Public Records
Tax History
| Year | Tax Paid | Tax Assessment Tax Assessment Total Assessment is a certain percentage of the fair market value that is determined by local assessors to be the total taxable value of land and additions on the property. | Land | Improvement |
|---|---|---|---|---|
| 2024 | $2,308 | $43,110 | $3,150 | $39,960 |
| 2023 | $2,098 | $39,010 | $2,850 | $36,160 |
| 2022 | $1,981 | $36,120 | $2,640 | $33,480 |
| 2021 | $1,902 | $34,400 | $2,510 | $31,890 |
| 2020 | $1,836 | $33,070 | $2,410 | $30,660 |
| 2019 | $1,782 | $32,110 | $2,340 | $29,770 |
| 2018 | $1,713 | $30,580 | $2,230 | $28,350 |
| 2017 | $1,690 | $29,980 | $2,190 | $27,790 |
| 2016 | $1,634 | $28,690 | $2,100 | $26,590 |
| 2015 | -- | $28,410 | $2,080 | $26,330 |
| 2014 | -- | $28,130 | $2,060 | $26,070 |
| 2013 | -- | $28,130 | $2,060 | $26,070 |
| 2012 | -- | $28,130 | $2,060 | $26,070 |
Source: Public Records
Map
Nearby Homes
- 13120 Augusta National Dr
- 8 N Country Club Rd
- 9 N Country Club Rd
- 21 N Country Club Rd
- 24 N Country Club Rd
- 12990 Country Club Rd
- Lot 3 N 1000th Rd
- 14689 N Court 6
- 14748 N Court 7
- 14744 N Court 1
- 14704 N Court 1
- 9626 N 1115th St
- 9313 N 1000th Rd
- 15243 N Holden Ave
- 9284 E Court 11
- 9219 E Best Ct
- 1600 W Fayette Ave
- 102 Illini Dr
- 0 S Lakewood Dr
- 21 N Lakewood Dr
- 12111 N 1000th Rd
- 12165 N 1000th Rd
- 12261 N 1000th Rd
- 9911 E Us Highway 40
- 11978 N 1000th Rd
- 11980 N 1000th Rd
- 9900 E Us Highway 40
- 11952 N 1000th Rd
- 9772 E Us Highway 40
- 9703 E Us Highway 40 No Street Suffix
- 9703 U S 40
- 9724 U S 40
- 9724 E Us Highway 40
- 9703 E Us Highway 40
- 12236 N 970th St
- 12260 N 970th St
- 12288 N 970th St
- 12243 N 970th St
- 12225 N 970th St
- 12263 N 970th St