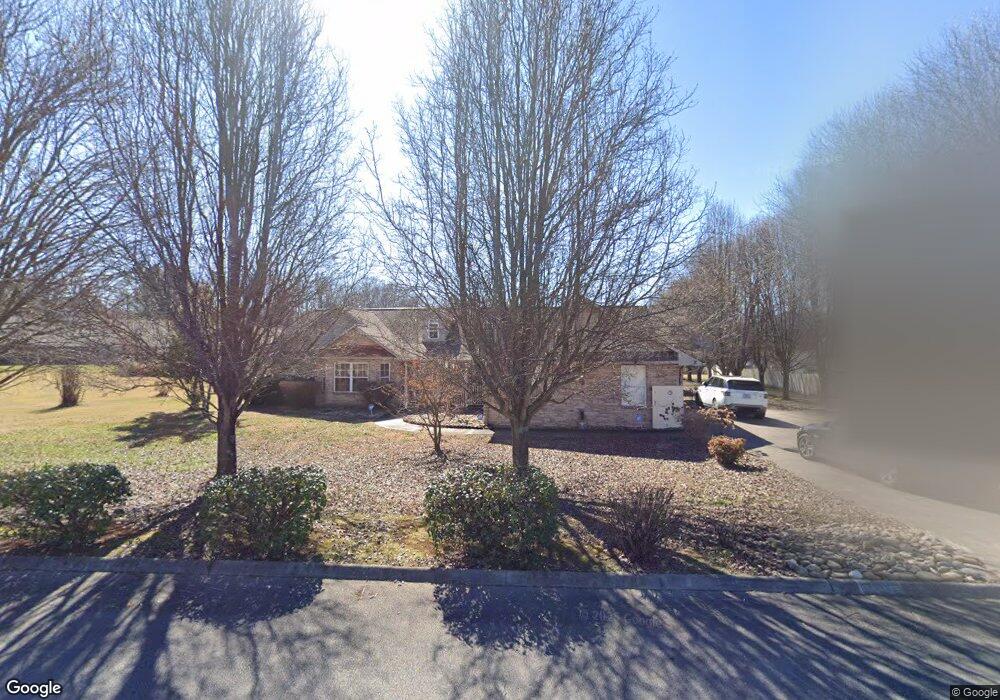
1214 Blake Lea Sevierville, TN 37862
Estimated Value: $462,000 - $481,337
--
Bed
2
Baths
2,476
Sq Ft
$190/Sq Ft
Est. Value
About This Home
This home is located at 1214 Blake Lea, Sevierville, TN 37862 and is currently estimated at $471,669, approximately $190 per square foot. 1214 Blake Lea is a home located in Sevier County with nearby schools including Catons Chapel Elementary School, Northview Elementary School, and Jones Cove Elementary School.
Ownership History
Date
Name
Owned For
Owner Type
Purchase Details
Closed on
Oct 18, 2007
Sold by
Steider Dean J
Bought by
Steider Dean J
Current Estimated Value
Purchase Details
Closed on
Aug 26, 2003
Sold by
Darrell Keene
Bought by
Vijay Rohira
Home Financials for this Owner
Home Financials are based on the most recent Mortgage that was taken out on this home.
Original Mortgage
$150,000
Interest Rate
5.94%
Purchase Details
Closed on
May 1, 2003
Sold by
Floyd Jeffery S
Bought by
Darrell Keene
Home Financials for this Owner
Home Financials are based on the most recent Mortgage that was taken out on this home.
Original Mortgage
$35,000
Interest Rate
5.76%
Purchase Details
Closed on
Dec 3, 2002
Sold by
Weiss Arnold M Sub Tr Et A
Bought by
Floyd Jeffrey S
Purchase Details
Closed on
Jun 1, 2000
Bought by
Moody Mickey and Moody Joyce
Create a Home Valuation Report for This Property
The Home Valuation Report is an in-depth analysis detailing your home's value as well as a comparison with similar homes in the area
Home Values in the Area
Average Home Value in this Area
Purchase History
| Date | Buyer | Sale Price | Title Company |
|---|---|---|---|
| Steider Dean J | -- | -- | |
| Vijay Rohira | $191,000 | -- | |
| Darrell Keene | $35,000 | -- | |
| Floyd Jeffrey S | $179,901 | -- | |
| Moody Mickey | $26,900 | -- |
Source: Public Records
Mortgage History
| Date | Status | Borrower | Loan Amount |
|---|---|---|---|
| Previous Owner | Moody Mickey | $150,000 | |
| Previous Owner | Moody Mickey | $35,000 |
Source: Public Records
Tax History Compared to Growth
Tax History
| Year | Tax Paid | Tax Assessment Tax Assessment Total Assessment is a certain percentage of the fair market value that is determined by local assessors to be the total taxable value of land and additions on the property. | Land | Improvement |
|---|---|---|---|---|
| 2025 | $2,394 | $80,875 | $12,250 | $68,625 |
| 2024 | $2,394 | $80,875 | $12,250 | $68,625 |
| 2023 | $2,394 | $80,875 | $0 | $0 |
| 2022 | $1,541 | $80,875 | $12,250 | $68,625 |
| 2021 | $1,541 | $80,875 | $12,250 | $68,625 |
| 2020 | $1,356 | $80,875 | $12,250 | $68,625 |
| 2019 | $1,356 | $57,550 | $12,250 | $45,300 |
| 2018 | $1,356 | $57,550 | $12,250 | $45,300 |
| 2017 | $1,356 | $57,550 | $12,250 | $45,300 |
| 2016 | $1,248 | $57,550 | $12,250 | $45,300 |
| 2015 | -- | $58,000 | $0 | $0 |
| 2014 | $1,125 | $57,994 | $0 | $0 |
Source: Public Records
Map
Nearby Homes
- 1218 Ernest McMahan Rd
- 1013 Columbine Lea
- 1220 Ariell Lea
- 1316 Mountain Meadows Way
- 1201 Briar Lea
- 410 Fleeta Williams Way
- 1056 Watch Hill Way
- 1064 Watch Hill Way
- 1043 Watch Hill Way
- 1072 Watch Hill Way
- 1067 Watch Hill Way
- 456 Fleeta Williams Way
- 960 Dogwood Ln
- 915 Fine Glen Dr
- 932 Mountain Berry Dr
- Lot 960A Dogwood Ln
- 1202 Foxwood Dr
- 1350 Snappwood Dr
- 1208 Jenna Ct
- 1042 Fine Glen Dr
- 1210 Blake Lea
- 1213 Blake Lea
- 1209 Blake Lea
- 1206 Blake Lea
- 1218 Blake Lea
- 989 Belle Meadows Blvd
- 1224 Ernest McMahan Rd
- 1205 Blake Lea
- 1228 Ernest McMahan Rd Unit 4
- 1230 Ernest McMahan Rd
- 1220 Ernest McMahan Rd
- 1226 Ernest McMahan Rd
- 1210 Ernest McMahan Rd
- 1202 Blake Lea
- 1232 Ernest McMahan Rd
- 1206 Ernest McMahan Rd
- 1234 Ernest McMahan Rd
- 991 Belle Meadows Blvd
- 1206 Luke Lea
- 985 Belle Meadows Blvd