
1214 Conway Ln Reno, NV 89503
Kings Row NeighborhoodEstimated payment $2,556/month
Highlights
- Popular Property
- No Units Above
- Clubhouse
- Outdoor Pool
- City View
- Main Floor Bedroom
About This Home
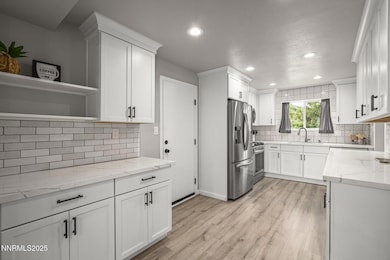
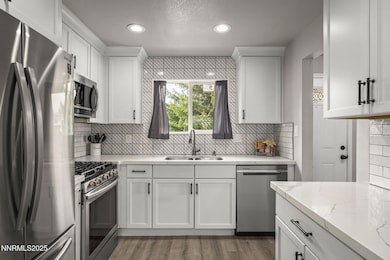
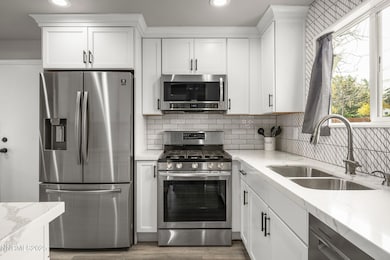
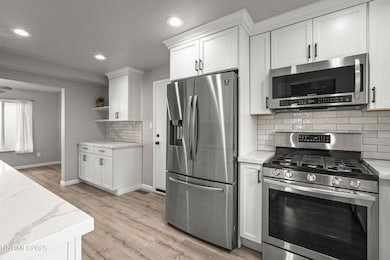
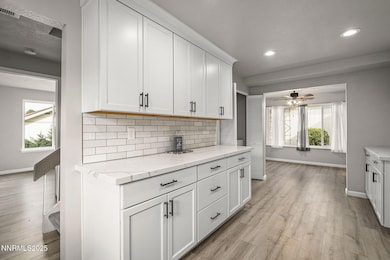
A rare opportunity to own a beautifully updated turn-key townhome that feels like a single-family home. Over 100,000 in thoughtful upgrades provide modern comfort and style. This desirable end unit offers exceptional privacy, a spacious front yard, a fully enclosed private patio, and an attached two-car garage with extensive storage. The upgraded kitchen features newer cabinetry, quartz countertops, subway tile backsplash, raised ceiling with recessed lighting, and stainless steel appliances. Laminate flooring runs throughout the home, and all windows were replaced in 2018. Both bathrooms have been remodeled with newer vanities, updated lighting, and a beautifully finished shower surround. The large primary bedroom includes a cathedral ceiling, creating an open and airy retreat. Acoustic ceilings were fully removed, retextured, and painted throughout for a clean modern feel. Community amenities include two swimming pools, a clubhouse, and serene common areas for relaxation and recreation. Move-in ready, low-maintenance living in a location close to shopping, dining, parks, and commuter access. Washer, dryer and refrigerator are included in purchase. Property to be sold AS IS, subject to buyer's inspections with seller performing no repairs.
Townhouse Details
Home Type
- Townhome
Est. Annual Taxes
- $1,014
Year Built
- Built in 1973
Lot Details
- 1,612 Sq Ft Lot
- No Units Above
- End Unit
- No Units Located Below
- 1 Common Wall
- Partially Fenced Property
HOA Fees
- $360 Monthly HOA Fees
Parking
- 2 Car Attached Garage
- Parking Storage or Cabinetry
- Garage Door Opener
Property Views
- City
- Peek-A-Boo
- Mountain
Home Design
- Pitched Roof
- Composition Roof
- Wood Siding
- Stick Built Home
Interior Spaces
- 1,343 Sq Ft Home
- 2-Story Property
- High Ceiling
- Ceiling Fan
- Wood Burning Fireplace
- Double Pane Windows
- Vinyl Clad Windows
- Plantation Shutters
- Drapes & Rods
- Blinds
- Living Room with Fireplace
- Combination Dining and Living Room
- Crawl Space
Kitchen
- Built-In Oven
- Gas Oven
- Microwave
- Dishwasher
- Disposal
Flooring
- Carpet
- Laminate
Bedrooms and Bathrooms
- 3 Bedrooms
- Main Floor Bedroom
- 2 Full Bathrooms
- Dual Sinks
- Bathtub and Shower Combination in Primary Bathroom
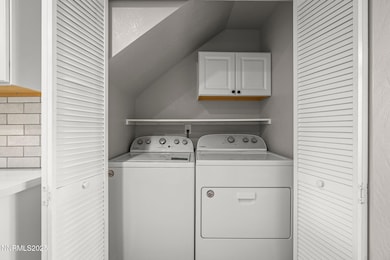
Laundry
- Laundry closet
- Dryer
- Washer
- Shelves in Laundry Area
Home Security
Outdoor Features
- Outdoor Pool
- Courtyard
Schools
- Towles Elementary School
- Clayton Middle School
- Mcqueen High School
Utilities
- No Cooling
- Forced Air Heating System
- Heating System Uses Natural Gas
- Natural Gas Connected
- Gas Water Heater
- Internet Available
- Phone Available
- Cable TV Available
Listing and Financial Details
- Assessor Parcel Number 00132031
Community Details
Overview
- $350 HOA Transfer Fee
- Associa Sierra North Association, Phone Number (775) 626-7333
- Reno Community
- Sierra Loma 1 Subdivision
- Maintained Community
- The community has rules related to covenants, conditions, and restrictions
Amenities
- Common Area
- Clubhouse
Recreation
- Community Pool
Security
- Resident Manager or Management On Site
- Card or Code Access
- Carbon Monoxide Detectors
- Fire and Smoke Detector
Map
Home Values in the Area
Average Home Value in this Area
Tax History
| Year | Tax Paid | Tax Assessment Tax Assessment Total Assessment is a certain percentage of the fair market value that is determined by local assessors to be the total taxable value of land and additions on the property. | Land | Improvement |
|---|---|---|---|---|
| 2025 | $985 | $47,818 | $29,680 | $18,138 |
| 2024 | $985 | $44,626 | $26,250 | $18,376 |
| 2023 | $957 | $42,894 | $27,020 | $15,874 |
| 2022 | $930 | $35,757 | $21,595 | $14,162 |
| 2021 | $903 | $31,345 | $16,695 | $14,650 |
| 2020 | $872 | $31,269 | $16,065 | $15,204 |
| 2019 | $848 | $30,989 | $16,030 | $14,959 |
| 2018 | $823 | $26,456 | $11,410 | $15,046 |
| 2017 | $798 | $25,996 | $10,675 | $15,321 |
| 2016 | $779 | $25,344 | $9,380 | $15,964 |
| 2015 | $197 | $23,238 | $7,105 | $16,133 |
| 2014 | $754 | $23,090 | $6,615 | $16,475 |
| 2013 | -- | $19,911 | $4,060 | $15,851 |
Property History
| Date | Event | Price | List to Sale | Price per Sq Ft |
|---|---|---|---|---|
| 11/07/2025 11/07/25 | For Sale | $399,900 | -- | $298 / Sq Ft |
Purchase History
| Date | Type | Sale Price | Title Company |
|---|---|---|---|
| Bargain Sale Deed | -- | None Available | |
| Bargain Sale Deed | -- | None Available | |
| Interfamily Deed Transfer | -- | None Available | |
| Interfamily Deed Transfer | -- | None Available | |
| Quit Claim Deed | -- | None Available | |
| Deed | -- | -- | |
| Interfamily Deed Transfer | -- | -- | |
| Interfamily Deed Transfer | -- | Comstock Title Company |
Source: Northern Nevada Regional MLS
MLS Number: 250057985
APN: 001-320-31
Disclaimer: Certain information contained herein is derived from information provided by parties other than Homes.com. All information provided is deemed reliable, but is not guaranteed to be accurate and should be independently verified.
![]() IDX information is provided exclusively for personal, non-commercial use, and may not be used for any purpose other than to identify prospective properties consumers may be interested in purchasing. Information is deemed reliable but not guaranteed. The content relating to real estate for sale on this web site comes in part from the Broker Reciprocity/ IDX program of the Northern Nevada Regional Multiple Listing Service°. Real estate listings held by brokerage firms other than Ten-X are marked with the Broker Reciprocity logo and detailed information about those listings includes the name of the listing brokerage. Any use of the content other than by a search performed by a consumer looking to purchase or rent real estate is prohibited. © 2025 Northern Nevada Regional Multiple Listing Service® MLS. All rights reserved.
IDX information is provided exclusively for personal, non-commercial use, and may not be used for any purpose other than to identify prospective properties consumers may be interested in purchasing. Information is deemed reliable but not guaranteed. The content relating to real estate for sale on this web site comes in part from the Broker Reciprocity/ IDX program of the Northern Nevada Regional Multiple Listing Service°. Real estate listings held by brokerage firms other than Ten-X are marked with the Broker Reciprocity logo and detailed information about those listings includes the name of the listing brokerage. Any use of the content other than by a search performed by a consumer looking to purchase or rent real estate is prohibited. © 2025 Northern Nevada Regional Multiple Listing Service® MLS. All rights reserved.
- 1245 Conway Ln
- 1149 Wagon Wheel Cir
- 1200 Wild Oak Ct
- 3405 Bowie Rd
- 3525 Zion Ln
- 1155 Beldon Way
- 1175 Akard Dr
- 3335 Downey Ave
- 995 Beldon Way
- 3050 Attridge Place
- 3020 Kings Row
- 730 James Ct
- 3264 Barbara Cir
- 3271 Heights Dr
- 2801 Kings Row
- 2860 Van Buren Dr
- 1455 Exeter Way
- 3235 Bryan St
- 2955 Scholl Dr
- 1822 Sierra Highlands Dr
- 4195 W 7th St
- 1175 Akard Dr
- 3045 Slater Ct
- 10640 N Mccarran Blvd
- 4985 W 7th St Unit 16
- 3280 Everett Dr
- 2643 Powder Dr
- 640 James Ln
- 730 Wyoming Ave
- 2175 Sierra Highlands Dr
- 1804 Quail Run Rd
- 1680 Sky Mountain Dr
- 1675 Sky Mountain Dr
- 3963 Kings Row
- 1965 Windsor Way
- 4775 Summit Ridge Dr
- 1550 Sky Valley Dr
- 1100 Solitude Trail
- 1295 Grand Summit Dr
- 5200 Summit Ridge Dr
