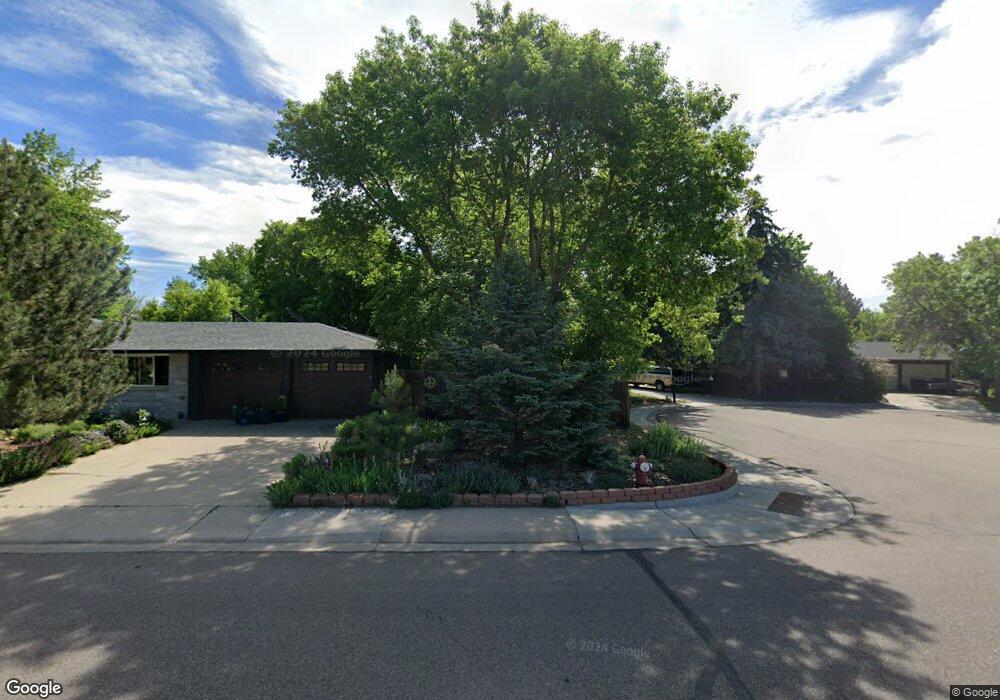
1214 Fordham St Longmont, CO 80503
Longmont Estates NeighborhoodEstimated Value: $520,000 - $577,000
3
Beds
2
Baths
1,344
Sq Ft
$404/Sq Ft
Est. Value
About This Home
This home is located at 1214 Fordham St, Longmont, CO 80503 and is currently estimated at $543,173, approximately $404 per square foot. 1214 Fordham St is a home located in Boulder County with nearby schools including Longmont Estates Elementary School, Westview Middle School, and Silver Creek High School.
Ownership History
Date
Name
Owned For
Owner Type
Purchase Details
Closed on
Feb 7, 2020
Sold by
Mavis A Martin A and Mavis Nancy J
Bought by
Martin And Nancy Mavis Living Trust
Current Estimated Value
Purchase Details
Closed on
Jun 26, 1998
Sold by
Bur Burkard Henry Charles Karen Van Kle
Bought by
Mavis A Martin
Home Financials for this Owner
Home Financials are based on the most recent Mortgage that was taken out on this home.
Original Mortgage
$126,750
Outstanding Balance
$26,119
Interest Rate
7.08%
Estimated Equity
$517,054
Purchase Details
Closed on
Feb 3, 1995
Sold by
Stafford William J and Stafford Carolyn M
Bought by
Burkard Henry Charles
Home Financials for this Owner
Home Financials are based on the most recent Mortgage that was taken out on this home.
Original Mortgage
$70,000
Interest Rate
9.13%
Purchase Details
Closed on
Jul 22, 1991
Bought by
Mavis A Martin A and Mavis Nancy J
Create a Home Valuation Report for This Property
The Home Valuation Report is an in-depth analysis detailing your home's value as well as a comparison with similar homes in the area
Home Values in the Area
Average Home Value in this Area
Purchase History
| Date | Buyer | Sale Price | Title Company |
|---|---|---|---|
| Martin And Nancy Mavis Living Trust | -- | None Available | |
| Mavis A Martin | $169,000 | -- | |
| Burkard Henry Charles | $154,950 | Commonwealth Land Title | |
| Stafford William J | -- | -- | |
| Mavis A Martin A | -- | -- |
Source: Public Records
Mortgage History
| Date | Status | Borrower | Loan Amount |
|---|---|---|---|
| Open | Mavis A Martin | $126,750 | |
| Previous Owner | Burkard Henry Charles | $70,000 |
Source: Public Records
Tax History Compared to Growth
Tax History
| Year | Tax Paid | Tax Assessment Tax Assessment Total Assessment is a certain percentage of the fair market value that is determined by local assessors to be the total taxable value of land and additions on the property. | Land | Improvement |
|---|---|---|---|---|
| 2025 | $2,212 | $31,019 | $10,600 | $20,419 |
| 2024 | $2,212 | $31,019 | $10,600 | $20,419 |
| 2023 | $2,182 | $29,828 | $11,826 | $21,688 |
| 2022 | $1,804 | $25,180 | $9,021 | $16,159 |
| 2021 | $1,827 | $25,905 | $9,281 | $16,624 |
| 2020 | $1,675 | $24,389 | $8,437 | $15,952 |
| 2019 | $1,648 | $24,389 | $8,437 | $15,952 |
| 2018 | $1,359 | $21,506 | $8,496 | $13,010 |
| 2017 | $1,340 | $23,777 | $9,393 | $14,384 |
| 2016 | $1,058 | $19,032 | $10,268 | $8,764 |
| 2015 | $1,009 | $16,334 | $4,378 | $11,956 |
| 2014 | $782 | $16,334 | $4,378 | $11,956 |
Source: Public Records
Map
Nearby Homes
- 1379 Charles Dr
- 1379 Charles Dr Unit 7
- 1379 Charles Dr Unit 4
- 1379 Charles Dr Unit 5
- 1379 Charles Dr Unit 3
- 2623 Elmhurst Cir
- 1106 Purdue Dr
- 1037 Purdue Dr
- 2810 Humboldt Cir
- 1345 Northwestern Rd
- 1013 Berkeley Ct
- 24 Cedar Ct
- 1262 Lanyon Ln
- 1448 Elmhurst Ct
- 2888 Humboldt Cir
- 2871 Humboldt Cir
- 1429 Auburn Ct
- 941 Reynolds Farm Ln Unit E8
- 1506 Fisk Ct
- 1440 Northwestern Rd
- 1208 Fordham St
- 1220 Fordham St
- 2639 Mountain View Ave
- 2635 Mountain View Ave
- 5798 Scenic Place
- 1228 Fordham St
- 2543 Scenic Place
- 1202 Fordham St
- 2549 Lanyon Dr
- 2545 Scenic Place
- 2631 Mountain View Ave
- 1234 Fordham St
- 2553 Lanyon Dr
- 2541 Scenic Place
- 1146 Fordham St
- 2710 Grinnell Dr
- 1225 Fordham St
- 2557 Lanyon Dr
- 2625 Mountain View Ave
- 1231 Fordham St