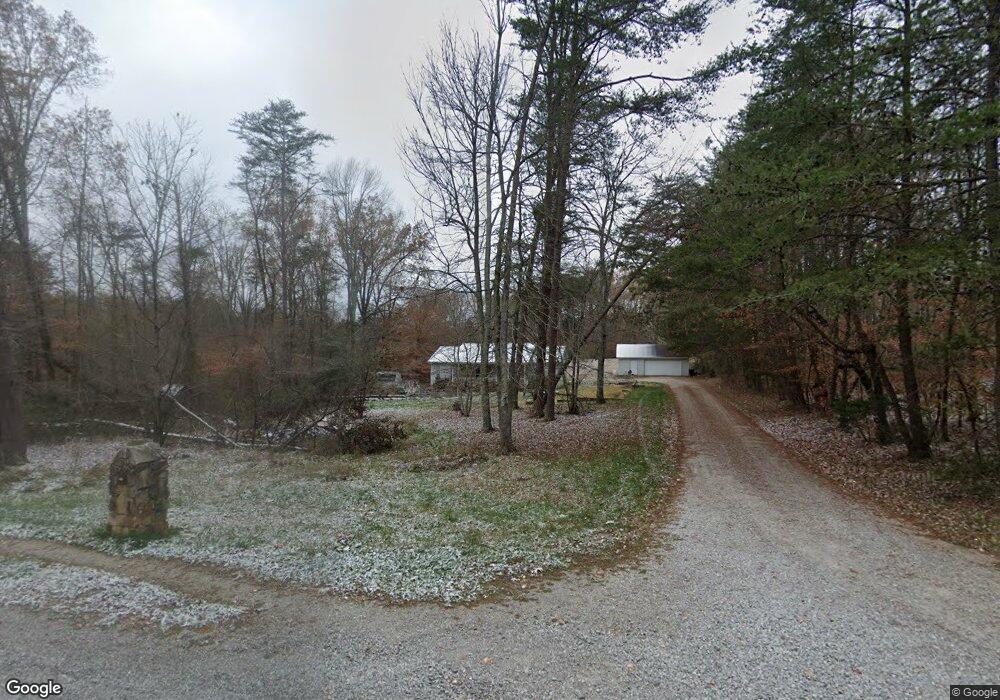
1214 Noel Dr Cookeville, TN 38506
Estimated Value: $224,748 - $283,000
--
Bed
2
Baths
1,404
Sq Ft
$176/Sq Ft
Est. Value
About This Home
This home is located at 1214 Noel Dr, Cookeville, TN 38506 and is currently estimated at $246,687, approximately $175 per square foot. 1214 Noel Dr is a home.
Ownership History
Date
Name
Owned For
Owner Type
Purchase Details
Closed on
Nov 9, 2009
Sold by
Vandivier Murrel W
Bought by
Love William R
Current Estimated Value
Home Financials for this Owner
Home Financials are based on the most recent Mortgage that was taken out on this home.
Original Mortgage
$89,250
Outstanding Balance
$58,038
Interest Rate
4.92%
Mortgage Type
Cash
Estimated Equity
$188,649
Purchase Details
Closed on
Aug 16, 1994
Bought by
Vandivier Murrel W
Purchase Details
Closed on
Dec 21, 1987
Bought by
Harness Mildred
Create a Home Valuation Report for This Property
The Home Valuation Report is an in-depth analysis detailing your home's value as well as a comparison with similar homes in the area
Home Values in the Area
Average Home Value in this Area
Purchase History
| Date | Buyer | Sale Price | Title Company |
|---|---|---|---|
| Love William R | $87,500 | -- | |
| Vandivier Murrel W | $58,500 | -- | |
| Harness Mildred | $4,800 | -- |
Source: Public Records
Mortgage History
| Date | Status | Borrower | Loan Amount |
|---|---|---|---|
| Open | Harness Mildred | $89,250 |
Source: Public Records
Tax History Compared to Growth
Tax History
| Year | Tax Paid | Tax Assessment Tax Assessment Total Assessment is a certain percentage of the fair market value that is determined by local assessors to be the total taxable value of land and additions on the property. | Land | Improvement |
|---|---|---|---|---|
| 2024 | $520 | $23,125 | $3,125 | $20,000 |
| 2023 | $456 | $23,125 | $3,125 | $20,000 |
| 2022 | $456 | $23,125 | $3,125 | $20,000 |
| 2021 | $456 | $23,125 | $3,125 | $20,000 |
| 2020 | $456 | $23,125 | $3,125 | $20,000 |
| 2019 | $499 | $22,175 | $3,125 | $19,050 |
| 2018 | $499 | $22,175 | $3,125 | $19,050 |
| 2017 | $499 | $22,175 | $3,125 | $19,050 |
| 2016 | $499 | $22,175 | $3,125 | $19,050 |
| 2015 | $441 | $22,175 | $3,125 | $19,050 |
| 2014 | -- | $22,175 | $3,125 | $19,050 |
| 2013 | -- | $24,700 | $0 | $0 |
Source: Public Records
Map
Nearby Homes