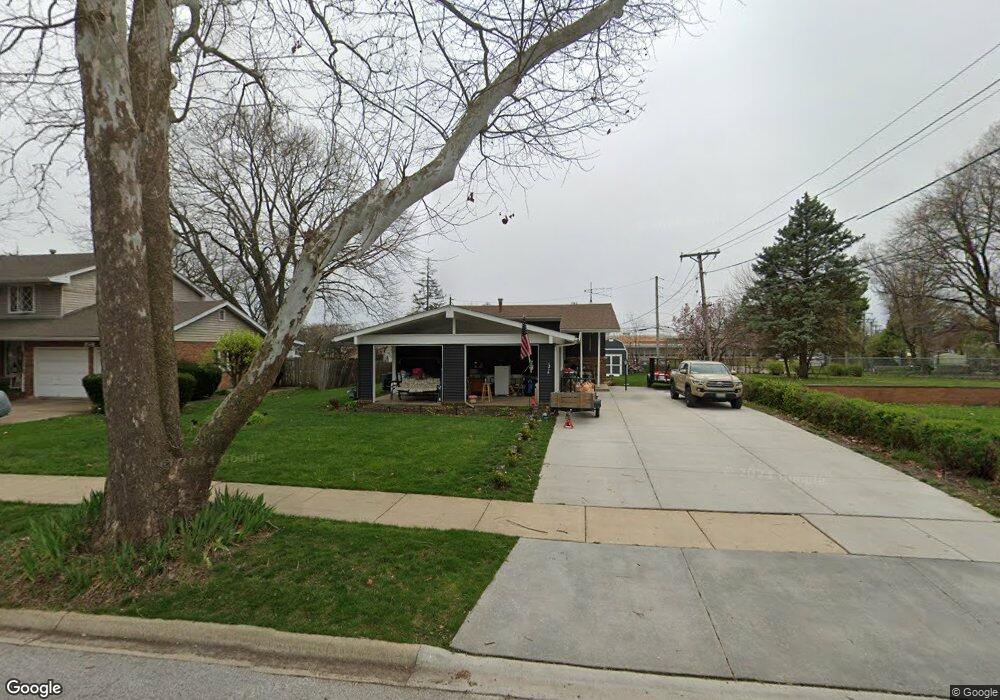
1214 Ottawa Ave Aurora, IL 60506
Blackhawk NeighborhoodEstimated Value: $277,393 - $328,000
--
Bed
1
Bath
2,168
Sq Ft
$141/Sq Ft
Est. Value
About This Home
This home is located at 1214 Ottawa Ave, Aurora, IL 60506 and is currently estimated at $306,098, approximately $141 per square foot. 1214 Ottawa Ave is a home located in Kane County with nearby schools including Mccleery Elementary School, Jefferson Middle School, and West Aurora High School.
Ownership History
Date
Name
Owned For
Owner Type
Purchase Details
Closed on
Dec 11, 2006
Sold by
Guardado Jose and Argueta Monico
Bought by
Argueta Monico and Argueta Diane M
Current Estimated Value
Home Financials for this Owner
Home Financials are based on the most recent Mortgage that was taken out on this home.
Original Mortgage
$201,450
Outstanding Balance
$137,538
Interest Rate
9.04%
Mortgage Type
New Conventional
Estimated Equity
$168,560
Purchase Details
Closed on
May 15, 2003
Sold by
Freda Bobbi L and Liska Patricia H
Bought by
Guardado Jose and Argueta Monico
Home Financials for this Owner
Home Financials are based on the most recent Mortgage that was taken out on this home.
Original Mortgage
$175,249
Interest Rate
5.3%
Mortgage Type
Purchase Money Mortgage
Purchase Details
Closed on
Mar 12, 2001
Sold by
Peterson Robert R
Bought by
Peterson Robert R and Freda Bobbi L
Create a Home Valuation Report for This Property
The Home Valuation Report is an in-depth analysis detailing your home's value as well as a comparison with similar homes in the area
Home Values in the Area
Average Home Value in this Area
Purchase History
| Date | Buyer | Sale Price | Title Company |
|---|---|---|---|
| Argueta Monico | -- | Commercial Land Title | |
| Guardado Jose | $178,000 | Chicago Title Insurance Co | |
| Peterson Robert R | -- | -- |
Source: Public Records
Mortgage History
| Date | Status | Borrower | Loan Amount |
|---|---|---|---|
| Open | Argueta Monico | $201,450 | |
| Previous Owner | Guardado Jose | $175,249 |
Source: Public Records
Tax History Compared to Growth
Tax History
| Year | Tax Paid | Tax Assessment Tax Assessment Total Assessment is a certain percentage of the fair market value that is determined by local assessors to be the total taxable value of land and additions on the property. | Land | Improvement |
|---|---|---|---|---|
| 2024 | $5,682 | $79,759 | $13,876 | $65,883 |
| 2023 | $5,419 | $71,264 | $12,398 | $58,866 |
| 2022 | $5,225 | $65,022 | $11,312 | $53,710 |
| 2021 | $4,983 | $60,537 | $10,532 | $50,005 |
| 2020 | $4,702 | $56,230 | $9,783 | $46,447 |
| 2019 | $4,849 | $55,588 | $9,064 | $46,524 |
| 2018 | $4,394 | $50,014 | $8,384 | $41,630 |
| 2017 | $5,326 | $57,750 | $7,725 | $50,025 |
| 2016 | $4,607 | $49,364 | $6,622 | $42,742 |
| 2015 | -- | $43,021 | $5,694 | $37,327 |
| 2014 | -- | $39,851 | $5,233 | $34,618 |
| 2013 | -- | $39,799 | $5,674 | $34,125 |
Source: Public Records
Map
Nearby Homes
- 1104 New Haven Ave
- 1351 Monomoy St Unit D
- 943 Charles St
- 1389 Monomoy St Unit B2
- 833 N Randall Rd Unit C4
- 781 N Elmwood Dr
- 795 N Elmwood Dr
- 616 Morton Ave
- 900 Charles St
- 930 W New York St Unit 932
- 809 W Park Ave
- 231 W Downer Place
- 931 W Downer Place
- 850 W Galena Blvd
- 115 Hillwood Place Unit 4B
- 972 Westgate Dr
- 113 Stonewood Place Unit 6D
- 1296 Yellowpine Dr
- 149 S Gladstone Ave
- 1735 Greene Ct
- 1200 Ottawa Ave
- 613 Iroquois Dr Unit 2
- 1170 Ottawa Ave
- 607 Iroquois Dr
- 1221 Ottawa Ave
- 1215 Ottawa Ave
- 1209 Ottawa Ave
- 1140 Ottawa Ave
- 1205 Ottawa Ave
- 603 Iroquois Dr
- 635 Iroquois Dr
- 1139 Ottawa Ave
- 620 Iroquois Dr
- 549 Iroquois Dr Unit 2
- 626 Iroquois Dr Unit 2
- 614 Iroquois Dr
- 641 Iroquois Dr
- 634 Cheyenne Ave Unit 1
- 1214 W Illinois Ave
- 1130 Ottawa Ave