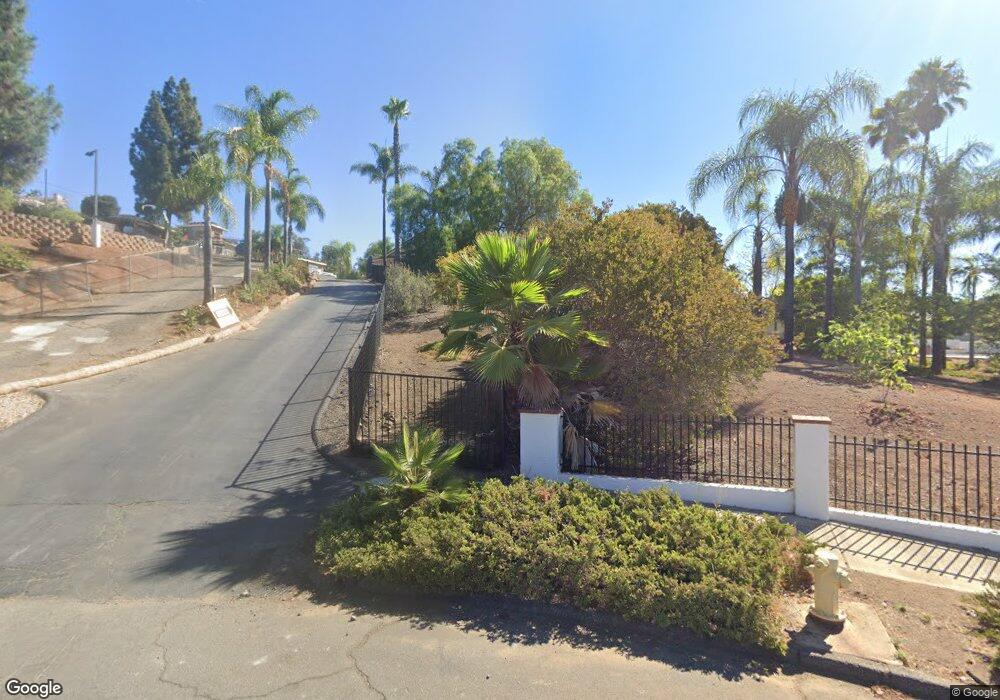
1214 Pleiades Dr Vista, CA 92084
Vista Valley NeighborhoodEstimated Value: $1,618,379 - $1,695,000
5
Beds
3
Baths
3,411
Sq Ft
$485/Sq Ft
Est. Value
About This Home
This home is located at 1214 Pleiades Dr, Vista, CA 92084 and is currently estimated at $1,653,845, approximately $484 per square foot. 1214 Pleiades Dr is a home located in San Diego County with nearby schools including Monte Vista Elementary School, Rancho Minerva Middle School, and Rancho Buena Vista High School.
Ownership History
Date
Name
Owned For
Owner Type
Purchase Details
Closed on
Jul 2, 2025
Sold by
Mcelhattan Fred and Mcelhattan Kimberly
Bought by
Mcelhattan Revocable Trust and Mcelhattan
Current Estimated Value
Purchase Details
Closed on
Aug 14, 2000
Sold by
Dover Essie R Pacific Builders Enterprises In
Bought by
Mcelhattan Fred and Mcelhattan Kimberly
Home Financials for this Owner
Home Financials are based on the most recent Mortgage that was taken out on this home.
Original Mortgage
$252,700
Interest Rate
8.07%
Purchase Details
Closed on
Jun 3, 1999
Sold by
Carr William A & Freda R Family Trust
Bought by
Pacific Builders Enterprises Inc
Home Financials for this Owner
Home Financials are based on the most recent Mortgage that was taken out on this home.
Original Mortgage
$70,000
Interest Rate
6.9%
Purchase Details
Closed on
Oct 25, 1995
Sold by
Carr William Arthur and Carr Freda R
Bought by
Carr William A and Carr Freda R
Create a Home Valuation Report for This Property
The Home Valuation Report is an in-depth analysis detailing your home's value as well as a comparison with similar homes in the area
Home Values in the Area
Average Home Value in this Area
Purchase History
| Date | Buyer | Sale Price | Title Company |
|---|---|---|---|
| Mcelhattan Revocable Trust | -- | None Listed On Document | |
| Mcelhattan Fred | $635,000 | Southland Title | |
| Pacific Builders Enterprises Inc | $140,000 | Commonwealth Land Title Co | |
| Carr William A | -- | -- |
Source: Public Records
Mortgage History
| Date | Status | Borrower | Loan Amount |
|---|---|---|---|
| Previous Owner | Mcelhattan Fred | $252,700 | |
| Previous Owner | Pacific Builders Enterprises Inc | $70,000 |
Source: Public Records
Tax History Compared to Growth
Tax History
| Year | Tax Paid | Tax Assessment Tax Assessment Total Assessment is a certain percentage of the fair market value that is determined by local assessors to be the total taxable value of land and additions on the property. | Land | Improvement |
|---|---|---|---|---|
| 2025 | $11,182 | $1,024,504 | $331,360 | $693,144 |
| 2024 | $11,182 | $975,004 | $295,451 | $679,553 |
| 2023 | $10,927 | $955,887 | $289,658 | $666,229 |
| 2022 | $10,901 | $937,145 | $283,979 | $653,166 |
| 2021 | $10,674 | $918,770 | $278,411 | $640,359 |
| 2020 | $10,642 | $909,350 | $275,557 | $633,793 |
| 2019 | $10,496 | $891,520 | $270,154 | $621,366 |
| 2018 | $10,005 | $874,040 | $264,857 | $609,183 |
| 2017 | $961 | $856,903 | $259,664 | $597,239 |
| 2016 | $9,623 | $840,102 | $254,573 | $585,529 |
| 2015 | $9,580 | $827,484 | $250,750 | $576,734 |
| 2014 | $9,355 | $811,276 | $245,839 | $565,437 |
Source: Public Records
Map
Nearby Homes
- 3188 Ora Avo Terrace
- 1130 Sugarbush Dr
- 1564 Manzanita Hollow
- 682 Ora Avo Ln
- 1525 Manzanita Hollow
- 3342 Silver Oak Ln
- 3412 Buena Creek Rd
- 1285 Hidden Oaks Trail
- 1628 Lone Oak Rd
- 2050 Buena Village Dr
- 2511 San Clemente Ave
- 2112 Savona Ct
- 2535 San Clemente Ave
- 3781 Buena Creek Rd
- 1175 York Dr
- 1624 Siddall Dr
- 2342 Carioca Place
- 3696 Camino de Las Lomas
- 1932 Victory Dr
- 0 Siddall Dr Unit OC25168275
- 1220 Pleiades Dr
- 1208 Pleiades Dr
- 1208 Starview Dr
- 1204 Starview Dr
- 0 Starview Dr
- 1133 Starview Dr
- 1232 Pleiades Dr
- 2847 Judiann Ln
- 1205 Pleiades Dr
- 1211 Starview Dr
- 1210 Starview Dr
- 1221 Pleiades Dr
- 1244 Pleiades Dr
- 1224 Starview Dr
- 1233 Pleiades Dr
- 1112 Starview Dr
- 000 Starview Dr
- 1211 Pleiades Dr
- 1100 Starview Dr
- 1233 Starview Dr