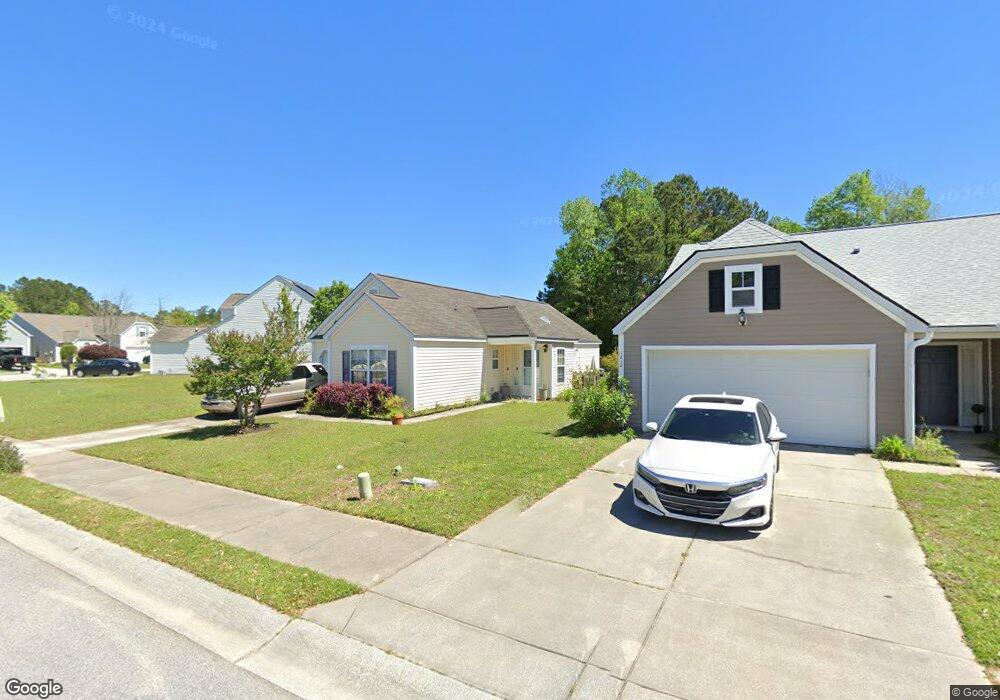
1214 Shadow Mist Ln Charleston, SC 29492
Wando NeighborhoodEstimated Value: $390,000 - $490,000
3
Beds
2
Baths
1,031
Sq Ft
$422/Sq Ft
Est. Value
About This Home
This home is located at 1214 Shadow Mist Ln, Charleston, SC 29492 and is currently estimated at $434,907, approximately $421 per square foot. 1214 Shadow Mist Ln is a home located in Berkeley County.
Ownership History
Date
Name
Owned For
Owner Type
Purchase Details
Closed on
Nov 21, 2011
Sold by
Fulp John R
Bought by
Glazier Sharon
Current Estimated Value
Home Financials for this Owner
Home Financials are based on the most recent Mortgage that was taken out on this home.
Original Mortgage
$111,110
Outstanding Balance
$75,215
Interest Rate
3.87%
Mortgage Type
FHA
Estimated Equity
$359,692
Purchase Details
Closed on
Sep 16, 2009
Sold by
The Fulp Llc
Bought by
Fulp John R
Purchase Details
Closed on
Jun 30, 2005
Sold by
Fulp John R and Fulp Kim H
Bought by
The Fulp Llc
Home Financials for this Owner
Home Financials are based on the most recent Mortgage that was taken out on this home.
Original Mortgage
$179,769
Interest Rate
5.08%
Mortgage Type
Purchase Money Mortgage
Purchase Details
Closed on
Jun 23, 2005
Sold by
D R Horton Inc
Bought by
Fulp John R and Fulp Kim H
Home Financials for this Owner
Home Financials are based on the most recent Mortgage that was taken out on this home.
Original Mortgage
$179,769
Interest Rate
5.08%
Mortgage Type
Purchase Money Mortgage
Create a Home Valuation Report for This Property
The Home Valuation Report is an in-depth analysis detailing your home's value as well as a comparison with similar homes in the area
Home Values in the Area
Average Home Value in this Area
Purchase History
| Date | Buyer | Sale Price | Title Company |
|---|---|---|---|
| Glazier Sharon | $114,000 | -- | |
| Fulp John R | -- | -- | |
| The Fulp Llc | -- | None Available | |
| Fulp John R | $195,890 | None Available |
Source: Public Records
Mortgage History
| Date | Status | Borrower | Loan Amount |
|---|---|---|---|
| Open | Glazier Sharon | $111,110 | |
| Previous Owner | Fulp John R | $179,769 |
Source: Public Records
Tax History Compared to Growth
Tax History
| Year | Tax Paid | Tax Assessment Tax Assessment Total Assessment is a certain percentage of the fair market value that is determined by local assessors to be the total taxable value of land and additions on the property. | Land | Improvement |
|---|---|---|---|---|
| 2025 | $1,185 | $173,228 | $54,148 | $119,080 |
| 2024 | $1,185 | $6,929 | $2,166 | $4,763 |
| 2023 | $1,185 | $6,929 | $2,166 | $4,763 |
| 2022 | $1,092 | $6,025 | $2,064 | $3,961 |
| 2021 | $1,111 | $6,020 | $2,064 | $3,961 |
| 2020 | $1,132 | $6,025 | $2,064 | $3,961 |
| 2019 | $1,152 | $6,025 | $2,064 | $3,961 |
| 2018 | $1,013 | $5,239 | $1,638 | $3,601 |
| 2017 | $1,012 | $5,239 | $1,638 | $3,601 |
| 2016 | $1,026 | $5,240 | $1,640 | $3,600 |
| 2015 | $962 | $5,240 | $1,640 | $3,600 |
| 2014 | $961 | $5,240 | $1,640 | $3,600 |
| 2013 | -- | $5,240 | $1,640 | $3,600 |
Source: Public Records
Map
Nearby Homes
- 1344 Palm Cove Dr
- 1295 Island Club Dr Unit C
- 1316 Island Club Dr Unit A
- 112 Berkshire Dr
- 1436 Water Edge Dr
- 1126 Peninsula Cove Dr
- 213 Ashmont Dr
- 1102 Waters Inlet Cir
- 237 Nelliefield Creek Dr
- 213 Nelliefield Creek Dr
- 308 Tidal Rice Ct
- 117 Wando Reach Rd
- 214 Rice Mill Place
- 133 Wando Reach Rd
- 1157 Oak Bluff Ave
- 1161 Oak Bluff Ave
- 1165 Oak Bluff Ave
- 420 Nelliefield Trail
- 142 Wando Reach Rd
- 141 Wando Reach Rd
- 1212 Shadow Mist Ln
- 1222 Shadow Mist Ln
- 1210 Shadow Mist Ln
- 1228 Shadow Mist Ln
- 1215 Shadow Mist Ln
- 1230 Shadow Mist Ln
- 1213 Shadow Mist Ln
- 1206 Shadow Mist Ln
- 1219 Shadow Mist Ln
- 1211 Shadow Mist Ln
- 1227 Shadow Mist Ln
- 1221 Shadow Mist Ln
- 1234 Shadow Mist Ln
- 1223 Shadow Mist Ln
- 1207 Shadow Mist Ln
- 1225 Shadow Mist Ln
- 1130 Ole Oak Dr
- 1236 Shadow Mist Ln
- 1122 Ole Oak Dr
- 1233 Shadow Mist Ln