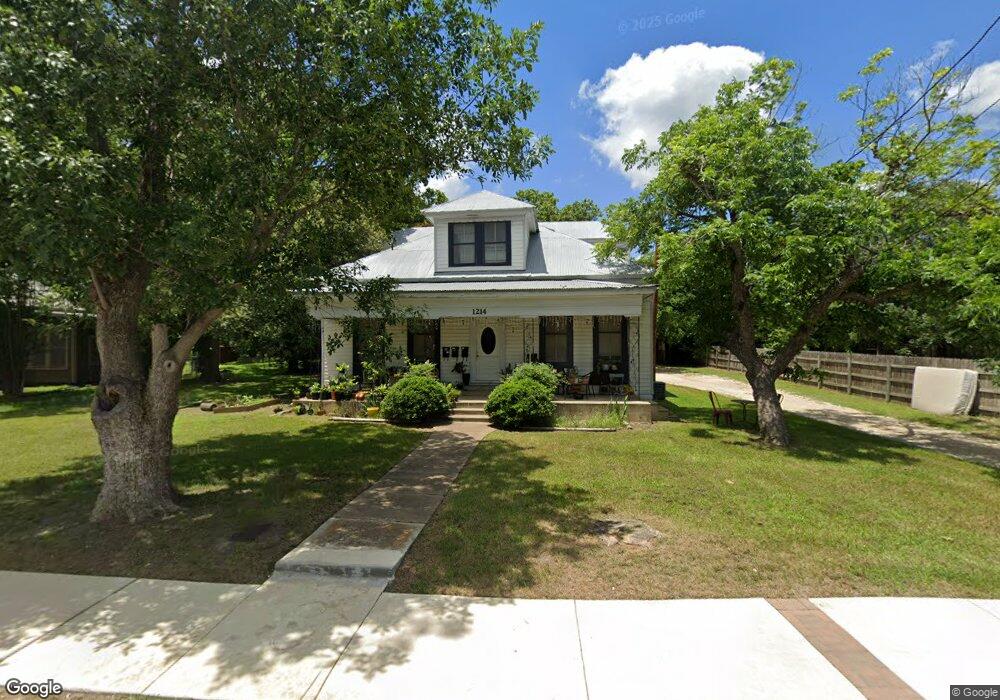
1214 W Hopkins St Unit C San Marcos, TX 78666
Heritage NeighborhoodEstimated Value: $336,921 - $525,000
1
Bed
1
Bath
650
Sq Ft
$653/Sq Ft
Est. Value
About This Home
This home is located at 1214 W Hopkins St Unit C, San Marcos, TX 78666 and is currently estimated at $424,730, approximately $653 per square foot. 1214 W Hopkins St Unit C is a home located in Hays County with nearby schools including Crockett Elementary School, Dorris Miller Middle School, and San Marcos High School.
Ownership History
Date
Name
Owned For
Owner Type
Purchase Details
Closed on
Feb 20, 2015
Sold by
Barkley Medora and Barkley John M
Bought by
Barkley House Holdings Lp
Current Estimated Value
Purchase Details
Closed on
Aug 27, 2010
Sold by
Craig Rodney and Craig Jill
Bought by
Barkley Medora
Home Financials for this Owner
Home Financials are based on the most recent Mortgage that was taken out on this home.
Original Mortgage
$126,000
Outstanding Balance
$83,875
Interest Rate
4.6%
Mortgage Type
New Conventional
Estimated Equity
$340,855
Purchase Details
Closed on
Feb 28, 2005
Sold by
Walch Robert J and Walch Elizabeth K
Bought by
Craig Rodney
Home Financials for this Owner
Home Financials are based on the most recent Mortgage that was taken out on this home.
Original Mortgage
$122,400
Interest Rate
5.77%
Mortgage Type
Purchase Money Mortgage
Purchase Details
Closed on
Dec 17, 1997
Sold by
Johns Brady L and Ingalls Ronald
Bought by
Barkley House Holdings Lp
Create a Home Valuation Report for This Property
The Home Valuation Report is an in-depth analysis detailing your home's value as well as a comparison with similar homes in the area
Home Values in the Area
Average Home Value in this Area
Purchase History
| Date | Buyer | Sale Price | Title Company |
|---|---|---|---|
| Barkley House Holdings Lp | -- | None Available | |
| Barkley Medora | -- | Independence Title | |
| Craig Rodney | -- | -- | |
| Barkley House Holdings Lp | -- | -- |
Source: Public Records
Mortgage History
| Date | Status | Borrower | Loan Amount |
|---|---|---|---|
| Open | Barkley Medora | $126,000 | |
| Previous Owner | Craig Rodney | $122,400 |
Source: Public Records
Tax History Compared to Growth
Tax History
| Year | Tax Paid | Tax Assessment Tax Assessment Total Assessment is a certain percentage of the fair market value that is determined by local assessors to be the total taxable value of land and additions on the property. | Land | Improvement |
|---|---|---|---|---|
| 2025 | $6,307 | $320,430 | $90,860 | $229,570 |
| 2024 | $6,307 | $320,430 | $90,860 | $229,570 |
| 2023 | $5,946 | $312,600 | $90,860 | $221,740 |
| 2022 | $5,527 | $269,715 | $72,380 | $197,335 |
| 2021 | $5,299 | $240,420 | $66,220 | $174,200 |
| 2020 | $5,160 | $245,960 | $66,220 | $179,740 |
| 2019 | $6,173 | $250,780 | $66,220 | $184,560 |
| 2018 | $5,154 | $208,430 | $32,040 | $176,390 |
| 2017 | $4,920 | $204,620 | $30,520 | $174,100 |
| 2016 | $4,641 | $193,030 | $30,520 | $162,510 |
| 2015 | $4,298 | $183,570 | $30,520 | $153,050 |
Source: Public Records
Map
Nearby Homes
- 1222 W Hopkins St
- 307 Quarry St
- 335 Veramendi St
- 102 Pitt St
- 833 Belvin St
- 203 S Mitchell St Unit 4
- 813 Bracewood Cir
- 1009 Advance St Unit 1011
- 1000 Advance St
- 800 N Bishop St
- 121 Scott St
- 1000 Advance #2 St
- 1010 Gravel St
- 1011 Gravel St
- 812 Gravel St
- 809-811 Perkins St
- 214 Jackman St
- 408 Railroad St
- 527 W San Antonio St
- 506 W San Antonio St Unit 205
- 1214 W Hopkins St Unit B
- 1214 W Hopkins St
- 1214 W Hopkins St Unit A
- 1202 W Hopkins St
- 1215 Belvin St
- 1229 Belvin St
- 1207 Belvin St
- 1232 W Hopkins St
- 1207 W Hopkins St
- 1203 Belvin St
- 1221 W Hopkins St Unit 15
- 1221 W Hopkins St Unit 12
- 1221 W Hopkins St Unit 11
- 1221 W Hopkins St Unit 10
- 1221 W Hopkins St Unit 9
- 1221 W Hopkins St Unit 8
- 1221 W Hopkins St Unit 7
- 1221 W Hopkins St Unit 6
- 1221 W Hopkins St Unit 5
- 1221 W Hopkins St Unit 4