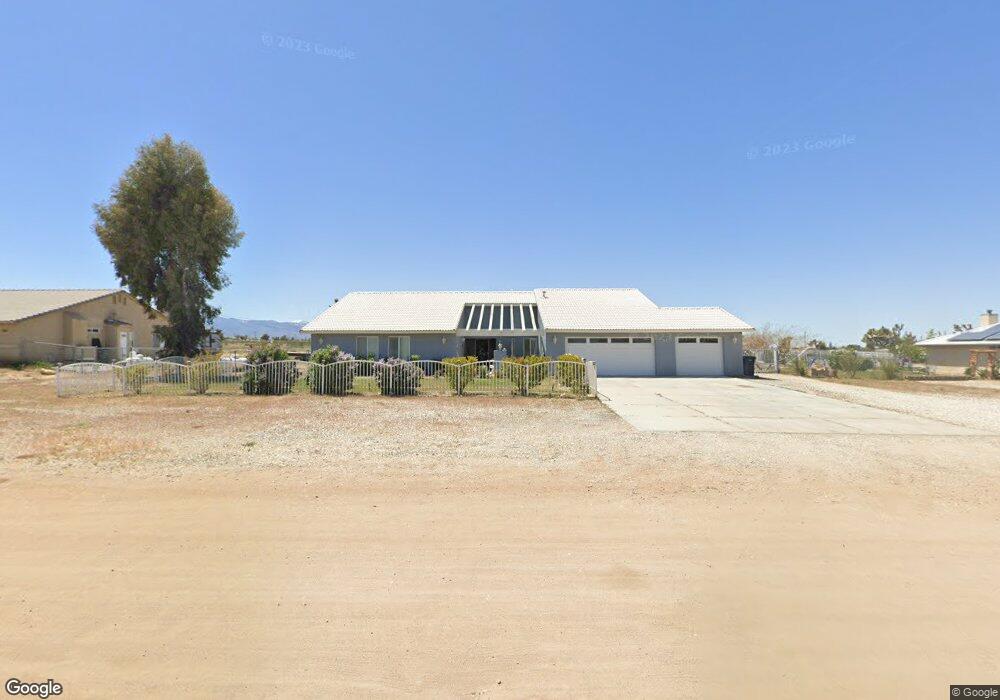
12140 Barker Rd Phelan, CA 92371
Estimated Value: $535,000 - $575,000
Studio
3
Baths
111
Sq Ft
$5,001/Sq Ft
Est. Value
About This Home
This home is located at 12140 Barker Rd, Phelan, CA 92371 and is currently estimated at $555,160, approximately $5,001 per square foot. 12140 Barker Rd is a home located in San Bernardino County with nearby schools including Phelan Elementary School, Quail Valley Middle School, and Serrano High School.
Ownership History
Date
Name
Owned For
Owner Type
Purchase Details
Closed on
Mar 2, 2020
Sold by
Hanks Craig D
Bought by
Toscano Bernardo Lopez
Current Estimated Value
Purchase Details
Closed on
Dec 30, 2019
Sold by
Potwardowski Laurene
Bought by
Garza Ofelia
Purchase Details
Closed on
Apr 28, 2014
Sold by
Hanks Maloree
Bought by
Hanks Craig D
Home Financials for this Owner
Home Financials are based on the most recent Mortgage that was taken out on this home.
Original Mortgage
$199,408
Interest Rate
4.38%
Mortgage Type
New Conventional
Purchase Details
Closed on
Apr 17, 2014
Sold by
Driskill Marye T
Bought by
Hanks Craig D
Home Financials for this Owner
Home Financials are based on the most recent Mortgage that was taken out on this home.
Original Mortgage
$199,408
Interest Rate
4.38%
Mortgage Type
New Conventional
Purchase Details
Closed on
Aug 27, 2002
Sold by
Grantham Vernell
Bought by
Driskill Dennis and Driskill Marye T
Create a Home Valuation Report for This Property
The Home Valuation Report is an in-depth analysis detailing your home's value as well as a comparison with similar homes in the area
Home Values in the Area
Average Home Value in this Area
Purchase History
| Date | Buyer | Sale Price | Title Company |
|---|---|---|---|
| Toscano Bernardo Lopez | $345,000 | Chicago Title Inalnd Empire | |
| Garza Ofelia | $20,000 | Chicago Title Company | |
| Hanks Craig D | -- | First American Title Company | |
| Hanks Craig D | $249,500 | First American Title Company | |
| Driskill Dennis | $17,000 | First American Title Ins Co |
Source: Public Records
Mortgage History
| Date | Status | Borrower | Loan Amount |
|---|---|---|---|
| Previous Owner | Hanks Craig D | $199,408 |
Source: Public Records
Tax History
| Year | Tax Paid | Tax Assessment Tax Assessment Total Assessment is a certain percentage of the fair market value that is determined by local assessors to be the total taxable value of land and additions on the property. | Land | Improvement |
|---|---|---|---|---|
| 2025 | $5,112 | $377,309 | $75,462 | $301,847 |
| 2024 | $4,674 | $369,910 | $73,982 | $295,928 |
| 2023 | $4,278 | $362,656 | $72,531 | $290,125 |
| 2022 | $4,179 | $355,545 | $71,109 | $284,436 |
| 2021 | $4,102 | $348,574 | $69,715 | $278,859 |
| 2020 | $3,331 | $279,394 | $55,878 | $223,516 |
| 2019 | $3,266 | $273,915 | $54,782 | $219,133 |
| 2018 | $3,050 | $268,544 | $53,708 | $214,836 |
| 2017 | $2,997 | $263,279 | $52,655 | $210,624 |
| 2016 | $2,932 | $258,117 | $51,623 | $206,494 |
| 2015 | $2,898 | $254,240 | $50,848 | $203,392 |
| 2014 | $2,578 | $224,300 | $44,900 | $179,400 |
Source: Public Records
Map
Nearby Homes
- 0 Sequoia Rd Unit PW26040494
- 5877 Goss Rd
- 0 Schultz Rd
- 0 Eaby Rd Unit IV25154513
- 0 Eaby Rd Unit HD23111448
- 0 Eaby Rd Unit HD25157986
- 2 Smith Rd
- 0 Smith S Unit IV26002753
- 0 Centola Rd Unit HD25270060
- 0 Del Rosa Rd Unit HD25155418
- 0 Sunset Rd Unit HD25093308
- 0 Schlitz Rd Unit RS25260072
- 15803 Paramount Rd
- 11524 Paramount Rd
- 313018 10302 Rancho Rd
- 7 Rancho Rd
- 0 Tricobble Ct Unit HD25067680
- 0 Rochester Unit IV25071086
- 0 Tricobble Ct Unit HD25067656
- 0 Camillia Rd Unit HD26021763
- 4085 Mirage Sheep Creek
- 0 Holister
- 0 Manada Wilson Ranch Unit 521649
- 0 Roberta Ranch Unit 520319
- 11035 Daisy Ln
- 0 Mongo Unit 15878785
- 0 Roberta Ranch Unit 502372
- 0 Wolfe Dr
- 0 Emblem (Hess Road)
- 9480 Mesa Rd
- 0 Middleton Yucca Terrace Unit 525450
- 11281 Eaby Rd
- 5707 Goss Rd
- 11226 Eaby Rd
- 12370 Joshua (2 Homes) Rd
- 9889 Acorn Rd
- 11711 Johnston
- 4118 US Hwy Unit 138
- 2628 S Montego Unit F
- 8001 Pipeline Rd
Your Personal Tour Guide
Ask me questions while you tour the home.