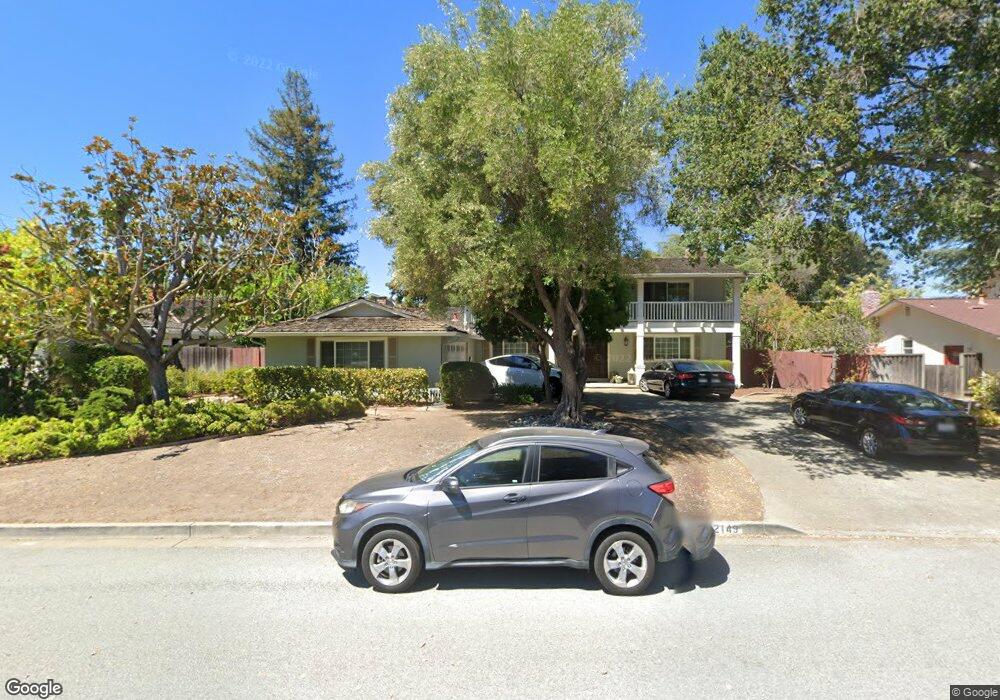
12149 Kristy Ln Saratoga, CA 95070
West San Jose NeighborhoodEstimated Value: $3,615,831 - $4,127,000
4
Beds
3
Baths
2,520
Sq Ft
$1,571/Sq Ft
Est. Value
About This Home
This home is located at 12149 Kristy Ln, Saratoga, CA 95070 and is currently estimated at $3,957,958, approximately $1,570 per square foot. 12149 Kristy Ln is a home located in Santa Clara County with nearby schools including Blue Hills Elementary School, Joaquin Miller Middle, and Lynbrook High School.
Ownership History
Date
Name
Owned For
Owner Type
Purchase Details
Closed on
Jan 11, 2015
Sold by
Haq Faisal and Haq Maimoona
Bought by
The 2000 Haq Family Trust and Haq Maimoona
Current Estimated Value
Purchase Details
Closed on
Feb 24, 2012
Sold by
Haq Faisal and Haq Maimoona
Bought by
Haq Faisal and Haq Maimoona Hamed
Home Financials for this Owner
Home Financials are based on the most recent Mortgage that was taken out on this home.
Original Mortgage
$417,000
Outstanding Balance
$276,005
Interest Rate
3.12%
Mortgage Type
New Conventional
Estimated Equity
$3,681,953
Purchase Details
Closed on
Jul 27, 2007
Sold by
Clemens Mary L and Heffernan Alexa A
Bought by
Haq Faisal and Haq Maimoona
Home Financials for this Owner
Home Financials are based on the most recent Mortgage that was taken out on this home.
Original Mortgage
$483,200
Interest Rate
6.65%
Mortgage Type
Credit Line Revolving
Purchase Details
Closed on
Apr 11, 2002
Sold by
Clemens Mary L
Bought by
Clemens Mary L and Roger & Mary Clemens Living Trust
Create a Home Valuation Report for This Property
The Home Valuation Report is an in-depth analysis detailing your home's value as well as a comparison with similar homes in the area
Home Values in the Area
Average Home Value in this Area
Purchase History
| Date | Buyer | Sale Price | Title Company |
|---|---|---|---|
| The 2000 Haq Family Trust | -- | None Available | |
| Haq Faisal | -- | Chicago Title Company | |
| Haq Faisal | $1,560,000 | Stewart Title Of Ca Inc | |
| Clemens Mary L | -- | -- | |
| Clemens Mary L | -- | -- |
Source: Public Records
Mortgage History
| Date | Status | Borrower | Loan Amount |
|---|---|---|---|
| Open | Haq Faisal | $417,000 | |
| Closed | Haq Faisal | $483,200 | |
| Closed | Haq Faisal | $630,000 |
Source: Public Records
Tax History Compared to Growth
Tax History
| Year | Tax Paid | Tax Assessment Tax Assessment Total Assessment is a certain percentage of the fair market value that is determined by local assessors to be the total taxable value of land and additions on the property. | Land | Improvement |
|---|---|---|---|---|
| 2025 | $24,278 | $2,049,078 | $1,536,812 | $512,266 |
| 2024 | $24,278 | $2,008,901 | $1,506,679 | $502,222 |
| 2023 | $24,080 | $1,969,512 | $1,477,137 | $492,375 |
| 2022 | $23,842 | $1,930,895 | $1,448,174 | $482,721 |
| 2021 | $23,585 | $1,893,035 | $1,419,779 | $473,256 |
| 2020 | $23,289 | $1,873,625 | $1,405,221 | $468,404 |
| 2019 | $22,737 | $1,836,888 | $1,377,668 | $459,220 |
| 2018 | $22,193 | $1,800,871 | $1,350,655 | $450,216 |
| 2017 | $22,078 | $1,765,561 | $1,324,172 | $441,389 |
| 2016 | $21,370 | $1,730,943 | $1,298,208 | $432,735 |
| 2015 | $21,207 | $1,704,943 | $1,278,708 | $426,235 |
| 2014 | $20,658 | $1,671,546 | $1,253,660 | $417,886 |
Source: Public Records
Map
Nearby Homes
- 1681 Danromas Way
- 12140 Woodside Dr
- 1587 Miller Ave
- 19920 Viewridge Dr
- 5635 W Walbrook Dr
- 13010 Glen Brae Dr
- 1577 Maurice Ln
- 19437 Via Real Dr
- 12790 Glen Arbor Ct
- 19423 Vineyard Ln
- 19113 Vineyard Ln
- 19662 Via Grande Dr
- 12584 Paseo Flores
- 11010 Maple Place Unit 25-06 Plan 4
- 10750 Elm Cir Unit 88-17 Plan 2
- 10730 Elm Cir Unit 86-17 Plan 2
- 11315 Cottonwood Place Unit 39-09 Plan 3
- Plan 2 at The Elms
- Plan 3 at The Elms
- Plan 4 at The Elms
- 12137 Kristy Ln
- 12161 Kristy Ln
- 19419 Melinda Cir
- 12128 Ingrid Ct
- 12150 Kristy Ln
- 12121 Kristy Ln
- 12138 Kristy Ln
- 19431 Melinda Cir
- 12120 Ingrid Ct
- 12122 Kristy Ln
- 19404 Melinda Cir
- 12105 Kristy Ln
- 19382 Melinda Cir
- 19466 Melinda Cir
- 19360 Melinda Cir
- 19443 Melinda Cir
- 12127 Ingrid Ct
- 12106 Kristy Ln
- 12187 Melinda Cir
- 12087 Kristy Ln