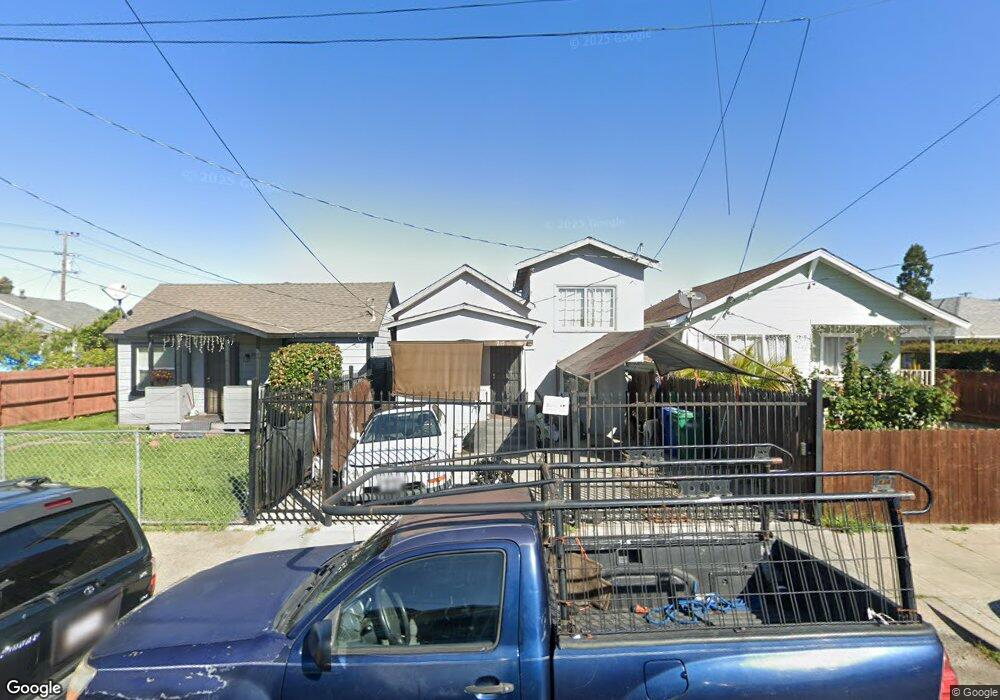
1215 94th Ave Oakland, CA 94603
Elmhurst Park NeighborhoodEstimated Value: $285,000 - $417,000
3
Beds
1
Bath
707
Sq Ft
$528/Sq Ft
Est. Value
About This Home
This home is located at 1215 94th Ave, Oakland, CA 94603 and is currently estimated at $373,124, approximately $527 per square foot. 1215 94th Ave is a home located in Alameda County with nearby schools including New Highland Academy, Acorn Woodland Elementary School, and Encompass Academy Elementary.
Ownership History
Date
Name
Owned For
Owner Type
Purchase Details
Closed on
Dec 11, 2018
Sold by
Brown Earl W
Bought by
Brown Linda Kaye
Current Estimated Value
Purchase Details
Closed on
Oct 16, 1995
Sold by
Young Brown Linda K and Young Linda Kaye
Bought by
Brown Earl W and Young Brown Linda K
Home Financials for this Owner
Home Financials are based on the most recent Mortgage that was taken out on this home.
Original Mortgage
$35,000
Interest Rate
7.59%
Create a Home Valuation Report for This Property
The Home Valuation Report is an in-depth analysis detailing your home's value as well as a comparison with similar homes in the area
Home Values in the Area
Average Home Value in this Area
Purchase History
| Date | Buyer | Sale Price | Title Company |
|---|---|---|---|
| Brown Linda Kaye | -- | None Listed On Document | |
| Brown Earl W | -- | Fidelity National Title Ins |
Source: Public Records
Mortgage History
| Date | Status | Borrower | Loan Amount |
|---|---|---|---|
| Previous Owner | Brown Earl W | $35,000 |
Source: Public Records
Tax History Compared to Growth
Tax History
| Year | Tax Paid | Tax Assessment Tax Assessment Total Assessment is a certain percentage of the fair market value that is determined by local assessors to be the total taxable value of land and additions on the property. | Land | Improvement |
|---|---|---|---|---|
| 2025 | $2,139 | $23,537 | $9,807 | $13,730 |
| 2024 | $2,139 | $23,074 | $9,614 | $13,460 |
| 2023 | $2,108 | $22,622 | $9,426 | $13,196 |
| 2022 | $1,973 | $22,179 | $9,241 | $12,938 |
| 2021 | $1,715 | $21,744 | $9,060 | $12,684 |
| 2020 | $1,694 | $21,521 | $8,967 | $12,554 |
| 2019 | $1,522 | $21,099 | $8,791 | $12,308 |
| 2018 | $1,495 | $20,686 | $8,619 | $12,067 |
| 2017 | $1,398 | $20,280 | $8,450 | $11,830 |
| 2016 | $1,249 | $19,882 | $8,284 | $11,598 |
| 2015 | $1,237 | $19,584 | $8,160 | $11,424 |
| 2014 | $1,122 | $19,200 | $8,000 | $11,200 |
Source: Public Records
Map
Nearby Homes