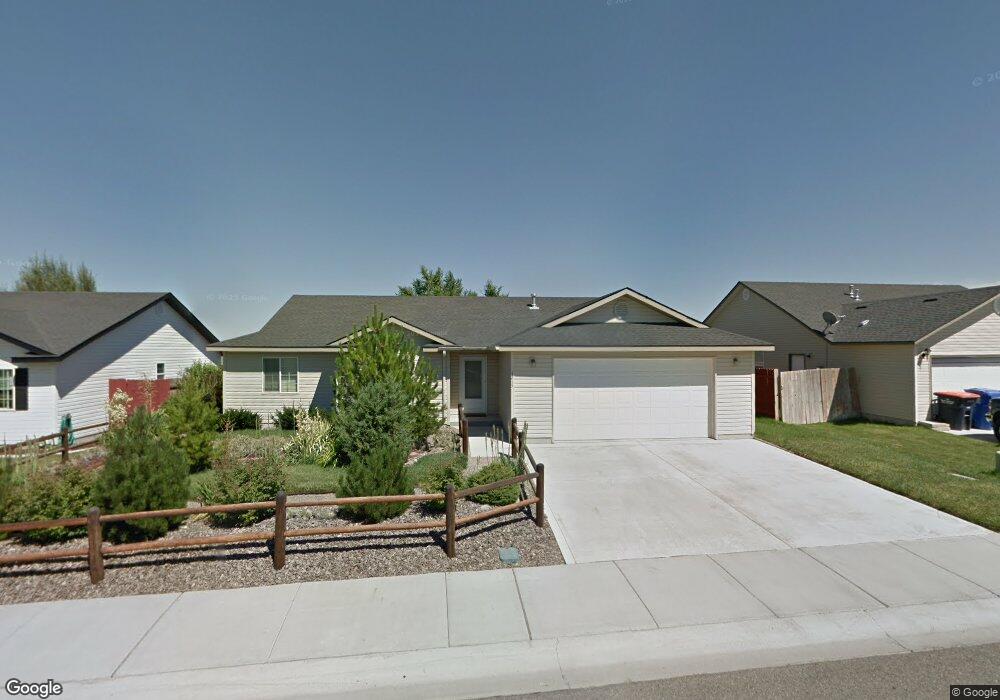
1215 Fiesta Way Twin Falls, ID 83301
Estimated Value: $327,000 - $354,536
4
Beds
2
Baths
1,523
Sq Ft
$226/Sq Ft
Est. Value
About This Home
This home is located at 1215 Fiesta Way, Twin Falls, ID 83301 and is currently estimated at $344,134, approximately $225 per square foot. 1215 Fiesta Way is a home located in Twin Falls County with nearby schools including Oregon Trail Elementary School, South Hills Middle School, and Twin Falls Senior High School.
Ownership History
Date
Name
Owned For
Owner Type
Purchase Details
Closed on
Sep 18, 2023
Sold by
Idaho Land Holding Llc
Bought by
Prosperity Partners Llc
Current Estimated Value
Purchase Details
Closed on
Mar 28, 2005
Sold by
Harmon Bruce J and Harmon Rhonda A
Bought by
Growney Lawrence P
Home Financials for this Owner
Home Financials are based on the most recent Mortgage that was taken out on this home.
Original Mortgage
$94,400
Interest Rate
6.25%
Mortgage Type
Adjustable Rate Mortgage/ARM
Purchase Details
Closed on
Jan 24, 2005
Sold by
Williams Ralph and Williams Linda
Bought by
Harmon Bruce J and Harmon Rhonda A
Home Financials for this Owner
Home Financials are based on the most recent Mortgage that was taken out on this home.
Original Mortgage
$81,732
Interest Rate
6.5%
Mortgage Type
Adjustable Rate Mortgage/ARM
Create a Home Valuation Report for This Property
The Home Valuation Report is an in-depth analysis detailing your home's value as well as a comparison with similar homes in the area
Home Values in the Area
Average Home Value in this Area
Purchase History
| Date | Buyer | Sale Price | Title Company |
|---|---|---|---|
| Prosperity Partners Llc | -- | None Listed On Document | |
| Growney Lawrence P | -- | -- | |
| Harmon Bruce J | -- | -- |
Source: Public Records
Mortgage History
| Date | Status | Borrower | Loan Amount |
|---|---|---|---|
| Previous Owner | Growney Lawrence P | $94,400 | |
| Previous Owner | Harmon Bruce J | $81,732 |
Source: Public Records
Tax History Compared to Growth
Tax History
| Year | Tax Paid | Tax Assessment Tax Assessment Total Assessment is a certain percentage of the fair market value that is determined by local assessors to be the total taxable value of land and additions on the property. | Land | Improvement |
|---|---|---|---|---|
| 2025 | $1,783 | $310,726 | $66,902 | $243,824 |
| 2024 | $1,783 | $313,736 | $66,902 | $246,834 |
| 2023 | $1,040 | $313,736 | $66,902 | $246,834 |
| 2022 | $2,280 | $324,113 | $60,172 | $263,941 |
| 2021 | $1,673 | $252,693 | $51,854 | $200,839 |
| 2020 | $708 | $204,720 | $47,740 | $156,980 |
| 2019 | $1,763 | $197,338 | $43,044 | $154,294 |
| 2018 | $1,723 | $184,007 | $29,092 | $154,915 |
| 2017 | $1,528 | $163,077 | $29,092 | $133,985 |
| 2016 | $1,388 | $138,457 | $0 | $0 |
| 2015 | $1,350 | $138,457 | $29,092 | $109,365 |
| 2012 | -- | $118,807 | $0 | $0 |
Source: Public Records
Map
Nearby Homes
- 1117 Valencia St
- 334 Pheasant Rd
- 1329 Haizlee Way
- 1348 Way
- 1357 Haizlee Way
- 1362 Haizlee Way
- 1376 Haizlee Way
- 1385 Haizlee Way
- 1390 Haizlee Way
- 1399 Haizlee Way
- 1413 Haizlee Way
- 1470 Haizlee Way
- 1445 Zephlyn St
- 1442 Haizlee Way
- 1459 Zephlyn St
- 1396 Haizlee Way
- 124 Pheasant Rd
- 1339 Washington St S
- 1384 Jump St
- 231 Sandi Rd
- 1223 Fiesta Way
- 1205 Fiesta Way
- 433 Lacasa Loop
- 1233 Fiesta Way
- 1187 Fiesta Way
- 437 Lacasa Loop
- 1216 Fiesta Way
- 1224 Fiesta Way
- 1206 Fiesta Way
- 429 Lacasa Loop
- 1245 Fiesta Way
- 1234 Fiesta Way
- 1130 Cortez Loop
- 1134 Cortez Loop
- 1188 Fiesta Way
- 441 Lacasa Loop
- 1246 Fiesta Way
- 1170 Fiesta Way
- 1257 Fiesta Way
- 1217 Valencia St