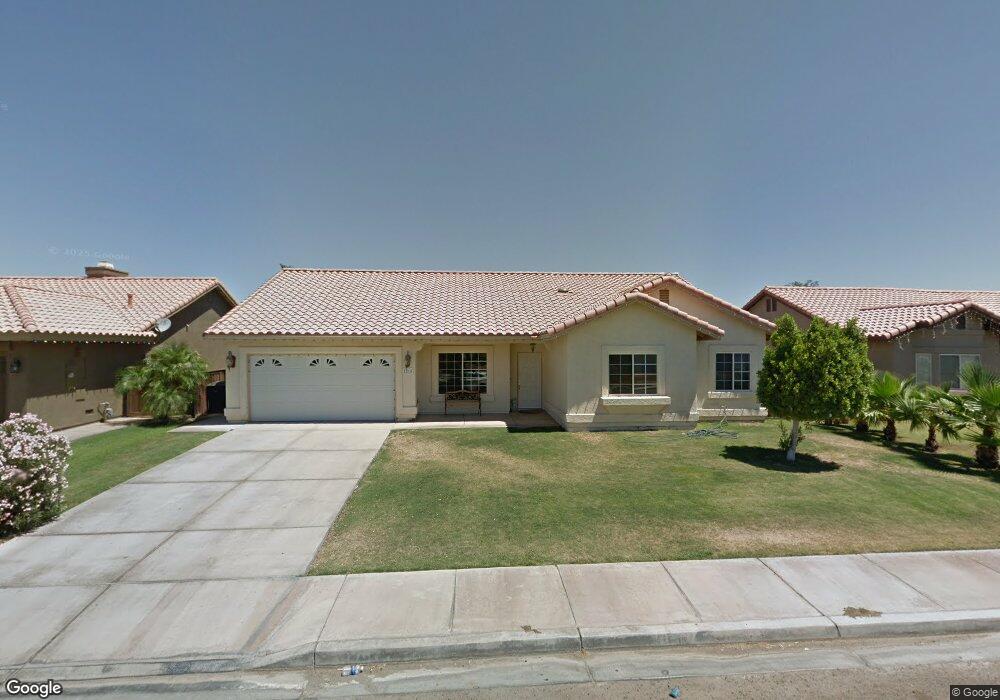
1215 Garnet St Calexico, CA 92231
Estimated Value: $422,482 - $444,000
4
Beds
2
Baths
1,468
Sq Ft
$294/Sq Ft
Est. Value
About This Home
This home is located at 1215 Garnet St, Calexico, CA 92231 and is currently estimated at $431,371, approximately $293 per square foot. 1215 Garnet St is a home located in Imperial County with nearby schools including Cesar Chavez Elementary School, Enrique Camarena Junior High School, and Calexico High School.
Ownership History
Date
Name
Owned For
Owner Type
Purchase Details
Closed on
Dec 24, 2002
Sold by
Ramirez Socorro Edith
Bought by
Ramirez Juan J and Ramirez Socorro E
Current Estimated Value
Home Financials for this Owner
Home Financials are based on the most recent Mortgage that was taken out on this home.
Original Mortgage
$151,000
Interest Rate
5.89%
Purchase Details
Closed on
Oct 4, 2000
Sold by
Ramirez Juan Jose
Bought by
Ramirez Socorro Edith
Home Financials for this Owner
Home Financials are based on the most recent Mortgage that was taken out on this home.
Original Mortgage
$142,450
Interest Rate
7.88%
Purchase Details
Closed on
Sep 20, 2000
Sold by
Meadows Associates Llc
Bought by
Ramirez Socorro Edith
Home Financials for this Owner
Home Financials are based on the most recent Mortgage that was taken out on this home.
Original Mortgage
$142,450
Interest Rate
7.88%
Create a Home Valuation Report for This Property
The Home Valuation Report is an in-depth analysis detailing your home's value as well as a comparison with similar homes in the area
Purchase History
| Date | Buyer | Sale Price | Title Company |
|---|---|---|---|
| Ramirez Juan J | -- | Chicago Title Co | |
| Ramirez Socorro Edith | -- | First American Title Ins Co | |
| Ramirez Socorro Edith | $150,000 | First American Title Ins Co |
Source: Public Records
Mortgage History
| Date | Status | Borrower | Loan Amount |
|---|---|---|---|
| Closed | Ramirez Juan J | $151,000 | |
| Previous Owner | Ramirez Socorro Edith | $142,450 |
Source: Public Records
Tax History
| Year | Tax Paid | Tax Assessment Tax Assessment Total Assessment is a certain percentage of the fair market value that is determined by local assessors to be the total taxable value of land and additions on the property. | Land | Improvement |
|---|---|---|---|---|
| 2025 | $2,745 | $225,931 | $48,205 | $177,726 |
| 2023 | $2,745 | $217,160 | $46,334 | $170,826 |
| 2022 | $2,658 | $212,903 | $45,426 | $167,477 |
| 2021 | $2,580 | $208,730 | $44,536 | $164,194 |
| 2020 | $2,485 | $206,591 | $44,080 | $162,511 |
| 2019 | $2,413 | $202,541 | $43,216 | $159,325 |
| 2018 | $2,391 | $198,570 | $42,369 | $156,201 |
| 2017 | $2,218 | $194,678 | $41,539 | $153,139 |
| 2016 | $2,116 | $190,862 | $40,725 | $150,137 |
| 2015 | $2,079 | $187,996 | $40,114 | $147,882 |
| 2014 | $1,763 | $160,012 | $48,000 | $112,012 |
Source: Public Records
Map
Nearby Homes
- 1160 Rosas St Unit 152
- 1179 Cabana St
- 1900 Rancho Frontera Ave Unit D25
- 1900 Rancho Frontera Ave Unit H59
- 1237 D Hinojosa St
- 2212 Polk Ave
- 1000 E Cole Rd
- 0 E Cole Rd Unit Lot 1 250029524
- 950 Santa Ana St
- 0 Avenida de Oro
- 816 Beach Ave
- 1301 W Calle de Oro
- 711 N Preston Dr
- 1245 C N Perry Rd
- 1213 C N Perry Rd
- 0 California 98
- 248 Hernandez St
- 1070 Heber Ave
- 1061 Heber Ave
- 817 E 6th St
- 1219 Garnet St
- 1211 Garnet St
- 1214 Sapphire St
- 1218 Sapphire St
- 1210 Sapphire St
- 1207 Garnet St
- 1223 Garnet St
- 1206 Sapphire St
- 1210 Garnet St
- 1222 Sapphire St
- 1218 Garnet St
- 1203 Garnet St
- 1209 Opal Ct
- 1206 Garnet St
- 1222 Garnet St
- 1202 Sapphire St
- 1268 Opal Ct
- 1249 Opal Ct
- 1202 Garnet St
- 1269 Opal Ct
Your Personal Tour Guide
Ask me questions while you tour the home.