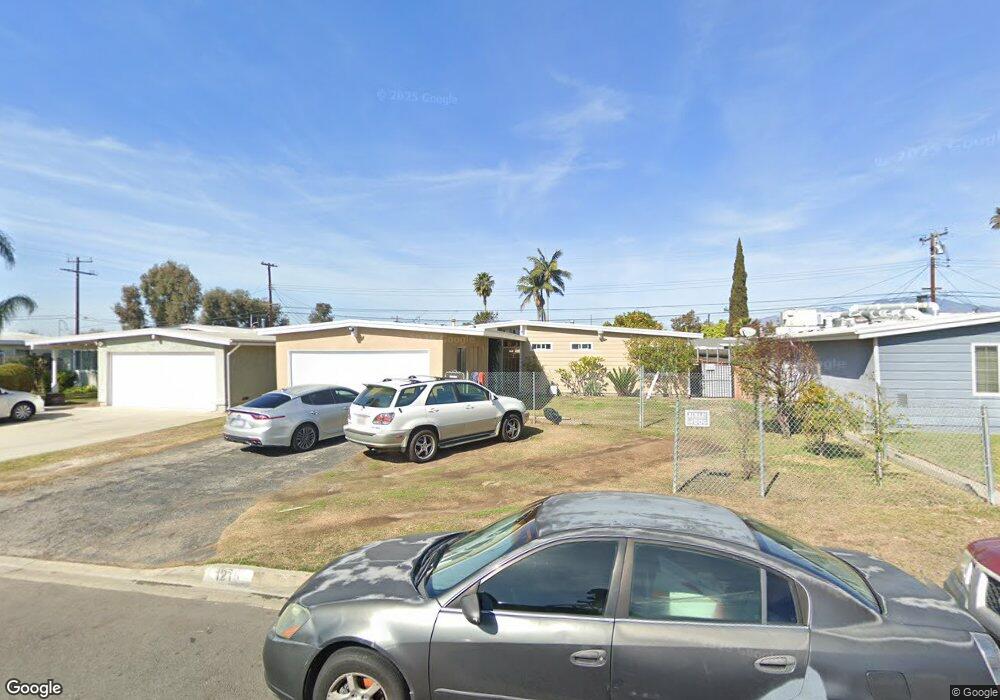
1215 Millbury Ave La Puente, CA 91746
West Puente Valley NeighborhoodEstimated Value: $643,000 - $752,000
3
Beds
2
Baths
1,123
Sq Ft
$614/Sq Ft
Est. Value
About This Home
This home is located at 1215 Millbury Ave, La Puente, CA 91746 and is currently estimated at $689,480, approximately $613 per square foot. 1215 Millbury Ave is a home located in Los Angeles County with nearby schools including J.E. Van Wig Elementary School, Torch Middle School, and Bassett Senior High School.
Ownership History
Date
Name
Owned For
Owner Type
Purchase Details
Closed on
Nov 13, 2008
Sold by
Hernandez Said
Bought by
Munoz Israel
Current Estimated Value
Home Financials for this Owner
Home Financials are based on the most recent Mortgage that was taken out on this home.
Original Mortgage
$209,198
Outstanding Balance
$139,943
Interest Rate
6.47%
Mortgage Type
FHA
Estimated Equity
$549,537
Purchase Details
Closed on
Dec 29, 2004
Sold by
Jazzar Namatallah and Jazzar Najibeh
Bought by
Hernandez Said
Home Financials for this Owner
Home Financials are based on the most recent Mortgage that was taken out on this home.
Original Mortgage
$280,000
Interest Rate
7.55%
Mortgage Type
Purchase Money Mortgage
Purchase Details
Closed on
May 1, 2001
Sold by
Jazzar Namatallah and Jazzar Najibeh
Bought by
Jazzar Namatallah
Create a Home Valuation Report for This Property
The Home Valuation Report is an in-depth analysis detailing your home's value as well as a comparison with similar homes in the area
Home Values in the Area
Average Home Value in this Area
Purchase History
| Date | Buyer | Sale Price | Title Company |
|---|---|---|---|
| Munoz Israel | $215,000 | Ticor Title Co | |
| Hernandez Said | $350,000 | Southland Title Company | |
| Jazzar Namatallah | -- | -- | |
| Jazzar Namatallah | -- | -- |
Source: Public Records
Mortgage History
| Date | Status | Borrower | Loan Amount |
|---|---|---|---|
| Open | Munoz Israel | $209,198 | |
| Previous Owner | Hernandez Said | $280,000 | |
| Closed | Hernandez Said | $70,000 |
Source: Public Records
Tax History Compared to Growth
Tax History
| Year | Tax Paid | Tax Assessment Tax Assessment Total Assessment is a certain percentage of the fair market value that is determined by local assessors to be the total taxable value of land and additions on the property. | Land | Improvement |
|---|---|---|---|---|
| 2025 | $3,865 | $276,853 | $217,625 | $59,228 |
| 2024 | $3,865 | $271,425 | $213,358 | $58,067 |
| 2023 | $3,751 | $266,104 | $209,175 | $56,929 |
| 2022 | $3,596 | $260,887 | $205,074 | $55,813 |
| 2021 | $3,529 | $255,772 | $201,053 | $54,719 |
| 2019 | $3,443 | $248,188 | $195,091 | $53,097 |
| 2018 | $3,259 | $243,322 | $191,266 | $52,056 |
| 2016 | $3,128 | $233,876 | $183,840 | $50,036 |
| 2015 | $3,052 | $230,364 | $181,079 | $49,285 |
| 2014 | $2,912 | $225,852 | $177,532 | $48,320 |
Source: Public Records
Map
Nearby Homes
- 1416 Millbury Ave
- 1003 Le Borgne Ave
- 14104 Barrydale St
- 13974 Francisquito Ave Unit 8
- 915 Stichman Ave
- 979 Willow Ave Unit 31
- 943 Willow Ave
- 720 Le Borgne Ave
- 1525 Bromley Ave
- 1718 Puente Ave Unit 40
- 1735 Puente Ave Unit 30
- 3060 Vineland Ave Unit 7
- 3004 Via Delores
- 13522 Francisquito Ave Unit C
- 3109 Robinette Ave
- 3314 Baldwin Park Blvd
- 13120 Dart St Unit E
- 13438 Francisquito Ave
- 13622 Hartsville St
- 13426 Austen Way
- 1209 Millbury Ave
- 1221 Millbury Ave
- 1214 Big Dalton Ave
- 1227 Millbury Ave
- 1203 Millbury Ave
- 1208 Big Dalton Ave
- 1226 Big Dalton Ave
- 1202 Big Dalton Ave
- 1214 Millbury Ave
- 1208 Millbury Ave
- 1220 Millbury Ave
- 1233 Millbury Ave
- 1226 Millbury Ave
- 1202 Millbury Ave
- 1232 Big Dalton Ave
- 1239 Millbury Ave
- 1232 Millbury Ave
- 1236 Big Dalton Ave
- 1215 Big Dalton Ave
- 1215 Van Wig Ave