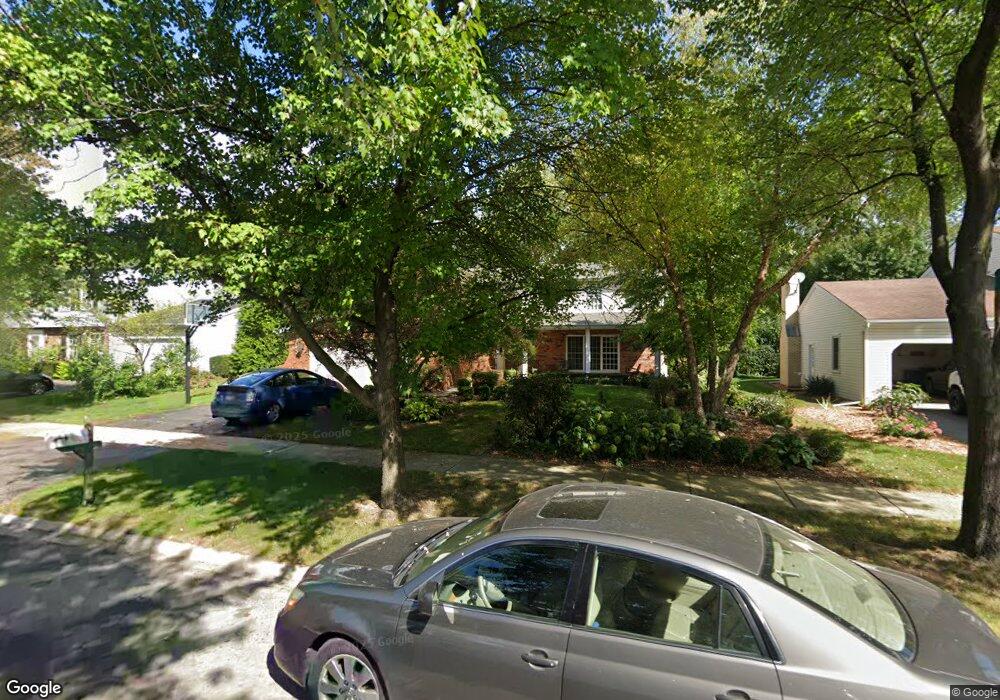
1215 Whitingham Cir Naperville, IL 60540
Pembrooke Greens NeighborhoodEstimated Value: $699,000 - $823,000
--
Bed
1
Bath
2,809
Sq Ft
$269/Sq Ft
Est. Value
About This Home
This home is located at 1215 Whitingham Cir, Naperville, IL 60540 and is currently estimated at $755,740, approximately $269 per square foot. 1215 Whitingham Cir is a home located in DuPage County with nearby schools including Prairie Elementary School, Admiral Byrd Elementary School, and Washington Jr High School.
Ownership History
Date
Name
Owned For
Owner Type
Purchase Details
Closed on
Mar 28, 2003
Sold by
Carlston Venton J and Carlston Kathleen O
Bought by
Carlston Venton J and Carlston Kathleen O
Current Estimated Value
Home Financials for this Owner
Home Financials are based on the most recent Mortgage that was taken out on this home.
Original Mortgage
$180,000
Interest Rate
5.76%
Purchase Details
Closed on
Jun 29, 1998
Sold by
Buchinger William J and Buchinger Eloise Beth
Bought by
Carlston Kenton J and Carlston Kathleen O
Home Financials for this Owner
Home Financials are based on the most recent Mortgage that was taken out on this home.
Original Mortgage
$107,000
Interest Rate
7.13%
Create a Home Valuation Report for This Property
The Home Valuation Report is an in-depth analysis detailing your home's value as well as a comparison with similar homes in the area
Home Values in the Area
Average Home Value in this Area
Purchase History
| Date | Buyer | Sale Price | Title Company |
|---|---|---|---|
| Carlston Venton J | -- | Law Title Ins Co | |
| Carlston Kenton J | $250,000 | Lawyers Title Pick Up |
Source: Public Records
Mortgage History
| Date | Status | Borrower | Loan Amount |
|---|---|---|---|
| Closed | Carlston Venton J | $180,000 | |
| Closed | Carlston Kenton J | $107,000 |
Source: Public Records
Tax History Compared to Growth
Tax History
| Year | Tax Paid | Tax Assessment Tax Assessment Total Assessment is a certain percentage of the fair market value that is determined by local assessors to be the total taxable value of land and additions on the property. | Land | Improvement |
|---|---|---|---|---|
| 2024 | $12,271 | $208,303 | $79,460 | $128,843 |
| 2023 | $11,833 | $190,110 | $72,520 | $117,590 |
| 2022 | $11,164 | $178,500 | $68,090 | $110,410 |
| 2021 | $10,758 | $171,740 | $65,510 | $106,230 |
| 2020 | $10,530 | $168,650 | $64,330 | $104,320 |
| 2019 | $10,226 | $161,360 | $61,550 | $99,810 |
| 2018 | $9,919 | $156,660 | $59,760 | $96,900 |
| 2017 | $9,721 | $151,370 | $57,740 | $93,630 |
| 2016 | $9,529 | $145,900 | $55,650 | $90,250 |
| 2015 | $9,472 | $137,400 | $52,410 | $84,990 |
| 2014 | $9,293 | $130,850 | $49,910 | $80,940 |
| 2013 | $9,153 | $131,160 | $50,030 | $81,130 |
Source: Public Records
Map
Nearby Homes
- 625 Edward Rd
- 1300 Old Dominion Rd
- 1386 Old Dominion Ct
- 1133 Catherine Ave
- 923 Tim Tam Cir
- 907 Secretariat Dr
- 820 Prairie Ave
- 1105 Johnson Dr
- 488 S Columbia St
- 440 S Columbia St
- 908 Julian Ct
- 912 E Chicago Ave
- 616 Driftwood Ct
- 915 E Chicago Ave
- 32 Westmoreland Ln
- 444 S Sleight St
- 3 Westmoreland Ln
- 1006 Bankfield Ct
- 203 S Columbia St
- 2880 Torrey Pine Ln Unit 2F
- 1219 Whitingham Cir
- 1211 Whitingham Cir
- 1220 Arthur Rd
- 1214 Arthur Rd
- 1223 Whitingham Cir
- 1207 Whitingham Cir
- 1226 Arthur Rd
- 1208 Arthur Rd
- 1218 Whitingham Cir
- 1212 Whitingham Cir
- 1222 Whitingham Cir
- 1232 Arthur Rd
- 1227 Whitingham Cir
- 1202 Arthur Rd
- 1172 Edward Rd
- 604 Edward Rd
- 1226 Whitingham Cir
- 616 Edward Rd
- 610 Edward Rd
- 1238 Arthur Rd