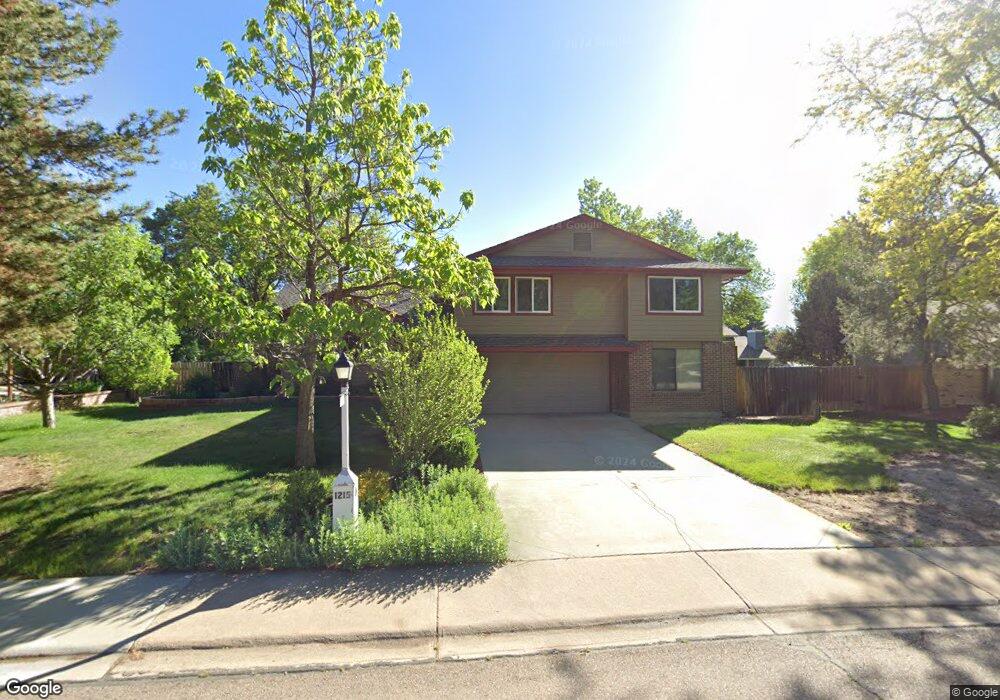
1215 Winslow Cir Longmont, CO 80504
Kensington NeighborhoodEstimated Value: $585,009 - $659,000
3
Beds
3
Baths
1,167
Sq Ft
$548/Sq Ft
Est. Value
About This Home
This home is located at 1215 Winslow Cir, Longmont, CO 80504 and is currently estimated at $639,502, approximately $547 per square foot. 1215 Winslow Cir is a home located in Boulder County with nearby schools including Rocky Mountain Elementary School, Trail Ridge Middle School, and Skyline High School.
Ownership History
Date
Name
Owned For
Owner Type
Purchase Details
Closed on
Sep 28, 2006
Sold by
Rentz Mary Ann
Bought by
Campbell Garland P
Current Estimated Value
Home Financials for this Owner
Home Financials are based on the most recent Mortgage that was taken out on this home.
Original Mortgage
$120,000
Interest Rate
6.51%
Mortgage Type
Purchase Money Mortgage
Purchase Details
Closed on
Aug 11, 1997
Sold by
Boeke Marilyn Yoder and Boeke Brandt B
Bought by
Boeke Marilyn Yoder
Home Financials for this Owner
Home Financials are based on the most recent Mortgage that was taken out on this home.
Original Mortgage
$25,000
Interest Rate
7.54%
Mortgage Type
Credit Line Revolving
Purchase Details
Closed on
Sep 13, 1989
Bought by
Campbell Garland P and Campbell Suzanne L
Purchase Details
Closed on
Aug 21, 1987
Bought by
Campbell Garland P and Campbell Suzanne L
Purchase Details
Closed on
Jul 28, 1978
Bought by
Campbell Garland P and Campbell Suzanne L
Create a Home Valuation Report for This Property
The Home Valuation Report is an in-depth analysis detailing your home's value as well as a comparison with similar homes in the area
Home Values in the Area
Average Home Value in this Area
Purchase History
| Date | Buyer | Sale Price | Title Company |
|---|---|---|---|
| Campbell Garland P | $277,900 | Fahtco | |
| Boeke Marilyn Yoder | -- | -- | |
| Campbell Garland P | $134,900 | -- | |
| Campbell Garland P | -- | -- | |
| Campbell Garland P | $72,800 | -- |
Source: Public Records
Mortgage History
| Date | Status | Borrower | Loan Amount |
|---|---|---|---|
| Closed | Campbell Garland P | $120,000 | |
| Previous Owner | Boeke Marilyn Yoder | $25,000 |
Source: Public Records
Tax History Compared to Growth
Tax History
| Year | Tax Paid | Tax Assessment Tax Assessment Total Assessment is a certain percentage of the fair market value that is determined by local assessors to be the total taxable value of land and additions on the property. | Land | Improvement |
|---|---|---|---|---|
| 2025 | $2,706 | $35,563 | $12,063 | $23,500 |
| 2024 | $2,706 | $35,563 | $12,063 | $23,500 |
| 2023 | $2,670 | $34,994 | $13,239 | $25,440 |
| 2022 | $2,218 | $29,364 | $9,320 | $20,044 |
| 2021 | $2,943 | $30,209 | $9,588 | $20,621 |
| 2020 | $2,637 | $27,142 | $8,366 | $18,776 |
| 2019 | $2,595 | $27,142 | $8,366 | $18,776 |
| 2018 | $2,401 | $25,279 | $6,336 | $18,943 |
| 2017 | $2,369 | $27,948 | $7,005 | $20,943 |
| 2016 | $2,258 | $23,618 | $8,995 | $14,623 |
| 2015 | $2,151 | $19,589 | $4,298 | $15,291 |
| 2014 | $1,830 | $19,589 | $4,298 | $15,291 |
Source: Public Records
Map
Nearby Homes
- 613 Rider Ridge Dr
- 618 Silver Star Ct
- 448 Morgan Rd
- 1615 Stardance Cir
- 1556 Stardance Cir
- 1267 E 9th Ave
- 12027 Saint Vrain Rd
- 729 Brookside Dr
- 836 Windflower Dr
- 750 Windflower Dr
- 902 Sugar Mill Ave
- 908 Sugar Mill Ave
- 756 Brookside Dr
- 811 Brookside Dr
- 741 Elliott St
- 265 High Point Dr Unit 201
- 265 High Point Dr Unit 203
- 265 High Point Dr Unit 207
- 1719 Stardance Cir
- 210 High Point Dr
- 1221 Winslow Cir
- 1209 Winslow Cir
- 6031 Fox Hill Dr
- 6025 Fox Hill Dr
- 6037 Fox Hill Dr
- 1227 Winslow Cir
- 1224 Winslow Cir
- 1202 Winslow Cir
- 1203 Winslow Cir
- 6015 Fox Hill Dr
- 6041 Fox Hill Dr
- 607 Crawford Cir
- 1233 Winslow Cir
- 1234 Winslow Cir
- 6036 Fox Hill Dr
- 6005 Fox Hill Dr
- 6024 Fox Hill Dr
- 613 Crawford Cir
- 1124 Merriman Place
- 6042 Fox Hill Dr