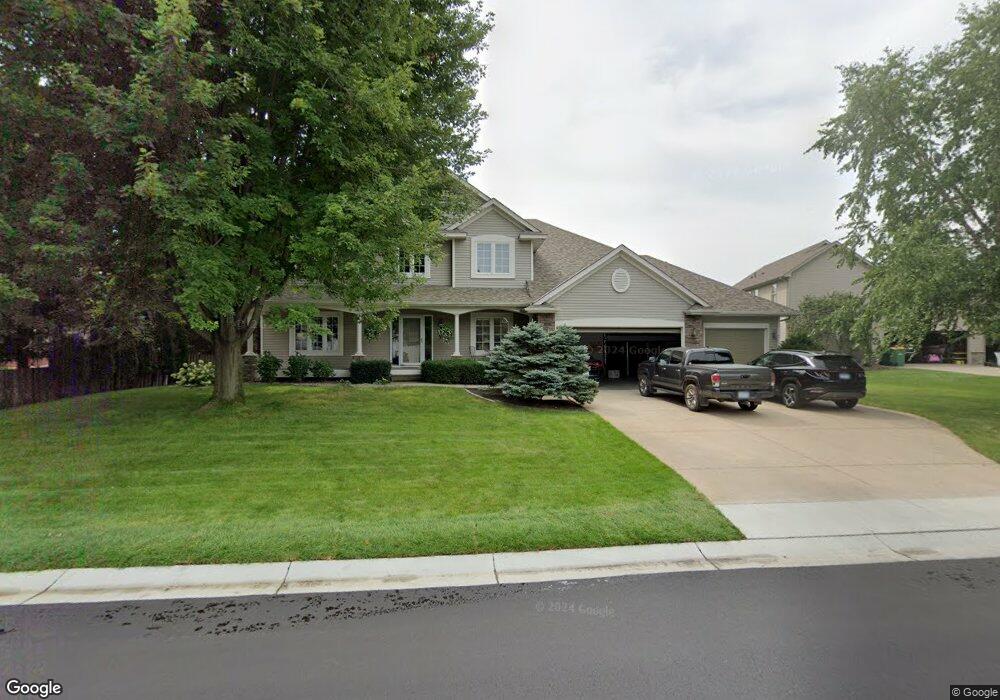
12153 Marquess Ln N Lake Elmo, MN 55042
Estimated Value: $610,000 - $776,000
4
Beds
5
Baths
2,490
Sq Ft
$273/Sq Ft
Est. Value
About This Home
This home is located at 12153 Marquess Ln N, Lake Elmo, MN 55042 and is currently estimated at $680,545, approximately $273 per square foot. 12153 Marquess Ln N is a home located in Washington County with nearby schools including Rutherford Elementary School, Stillwater Middle School, and Stillwater Area High School.
Ownership History
Date
Name
Owned For
Owner Type
Purchase Details
Closed on
May 7, 2020
Sold by
Ales Richard T and Ales Jodee M
Bought by
Ales Richard and Ales Jodee
Current Estimated Value
Home Financials for this Owner
Home Financials are based on the most recent Mortgage that was taken out on this home.
Original Mortgage
$315,439
Outstanding Balance
$160,159
Interest Rate
3.3%
Mortgage Type
New Conventional
Estimated Equity
$520,386
Purchase Details
Closed on
May 15, 2018
Sold by
Gwsa Land Development Llc
Bought by
Johson Jay E and Smith Anno J
Home Financials for this Owner
Home Financials are based on the most recent Mortgage that was taken out on this home.
Original Mortgage
$60,000
Interest Rate
4.4%
Mortgage Type
Credit Line Revolving
Purchase Details
Closed on
Oct 30, 2002
Sold by
Crescent Development Corp
Bought by
Blake Builders Inc
Purchase Details
Closed on
Nov 20, 2001
Sold by
College City Homes Inc
Bought by
Johnson Jay E and Smith Anne J
Create a Home Valuation Report for This Property
The Home Valuation Report is an in-depth analysis detailing your home's value as well as a comparison with similar homes in the area
Home Values in the Area
Average Home Value in this Area
Purchase History
| Date | Buyer | Sale Price | Title Company |
|---|---|---|---|
| Ales Richard | -- | None Available | |
| Johson Jay E | $355,000 | Custom Home Biuilders Title | |
| Blake Builders Inc | $130,000 | -- | |
| Johnson Jay E | $319,039 | -- |
Source: Public Records
Mortgage History
| Date | Status | Borrower | Loan Amount |
|---|---|---|---|
| Open | Ales Richard | $315,439 | |
| Closed | Johson Jay E | $60,000 |
Source: Public Records
Tax History Compared to Growth
Tax History
| Year | Tax Paid | Tax Assessment Tax Assessment Total Assessment is a certain percentage of the fair market value that is determined by local assessors to be the total taxable value of land and additions on the property. | Land | Improvement |
|---|---|---|---|---|
| 2024 | $5,958 | $555,000 | $135,000 | $420,000 |
| 2023 | $5,958 | $611,700 | $195,000 | $416,700 |
| 2022 | $4,840 | $559,200 | $162,700 | $396,500 |
| 2021 | $4,022 | $467,500 | $135,000 | $332,500 |
| 2020 | $4,042 | $433,200 | $122,500 | $310,700 |
| 2019 | $4,118 | $436,700 | $125,000 | $311,700 |
| 2018 | $3,578 | $418,500 | $125,000 | $293,500 |
| 2017 | $3,396 | $370,600 | $105,000 | $265,600 |
| 2016 | $3,460 | $363,200 | $97,600 | $265,600 |
| 2015 | $3,570 | $359,700 | $102,700 | $257,000 |
| 2013 | -- | $336,600 | $82,400 | $254,200 |
Source: Public Records
Map
Nearby Homes
- 11881 58th St N
- XXXX 50th St N
- 27XX Neal Ave N
- 4644 Linden Trail N
- 13085 56th St N
- 13105 56th St N
- 2866 Long Lake Dr
- 4531 McDonald Dr N
- 11676 Little Bluestem Ln N
- 2840 Brewers Ln
- 3350 Staples Place
- 3533 Eben Way
- 11459 Blazingstar Ln
- 1008 Northland Ave
- 11468 Blazingstar Ln
- 13420 49th St N
- 715 Liberty Ct
- 11454 Blazingstar Ln
- 11558 Wildflower Dr
- 4152 Hummingbird Ct N
- 12115 Marquess Ln N
- 12177 Marquess Lane Cove N
- 12167 Marquess Lane Cove N
- 12067 Marquess Ln N
- 12136 Marquess Ln N
- 12154 Marquess Ln N
- 12181 Marquess Lane Cove N
- 12035 Marquess Ln N
- 12122 Marquess Ln N
- 12172 Marquess Ln N
- 12023 Marquess Ln N
- 12100 Marquess Ln N
- 12187 Marquess Lane Cove N
- 12190 Marquess Ln N
- 12088 Marquess Ln N
- 12072 Marquess Ln N
- 12211 Marquess Lane Cove N
- 12056 Marquess Ln N
- 12114 Marquess Ln N
- 12195 Marquess Lane Cove N