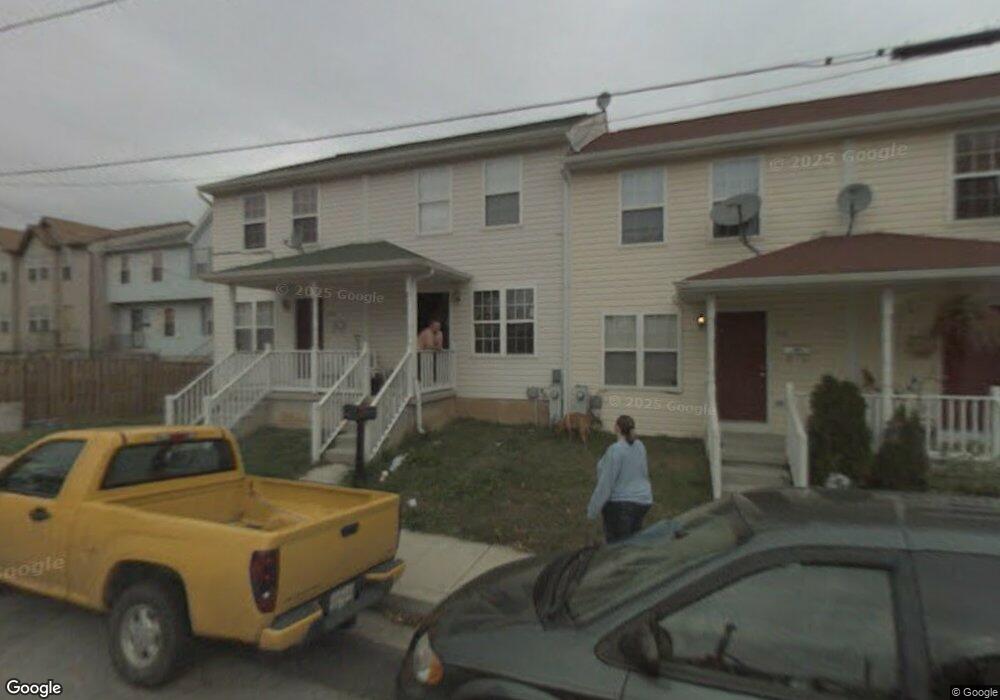
1216 Cambria St Brooklyn, MD 21225
Curtis Bay NeighborhoodEstimated Value: $97,000 - $247,307
3
Beds
2
Baths
840
Sq Ft
$205/Sq Ft
Est. Value
About This Home
This home is located at 1216 Cambria St, Brooklyn, MD 21225 and is currently estimated at $172,154, approximately $204 per square foot. 1216 Cambria St is a home located in Baltimore City with nearby schools including Curtis Bay Elementary School, Booker T. Washington Middle School, and Benjamin Franklin High School.
Ownership History
Date
Name
Owned For
Owner Type
Purchase Details
Closed on
Aug 1, 2016
Sold by
Cox Susan V and Case #24O15002819
Bought by
Dominion Rental Holdings Llc
Current Estimated Value
Purchase Details
Closed on
Jul 16, 2010
Sold by
Dominion Rentals Llc
Bought by
Cox Susan
Purchase Details
Closed on
Feb 17, 2010
Sold by
Bruce Bryan
Bought by
Dominion Rentals Llc
Purchase Details
Closed on
Oct 20, 2006
Sold by
Bruce Bryan
Bought by
Bruce Bryan and Bruce Amanda L
Home Financials for this Owner
Home Financials are based on the most recent Mortgage that was taken out on this home.
Original Mortgage
$128,350
Interest Rate
8.9%
Mortgage Type
New Conventional
Purchase Details
Closed on
Mar 19, 2003
Sold by
Baumgardner Construction Inc
Bought by
Bruce Bryan and Downing Amanda L
Purchase Details
Closed on
Mar 18, 1997
Bought by
Sanford Theodore B
Create a Home Valuation Report for This Property
The Home Valuation Report is an in-depth analysis detailing your home's value as well as a comparison with similar homes in the area
Home Values in the Area
Average Home Value in this Area
Purchase History
| Date | Buyer | Sale Price | Title Company |
|---|---|---|---|
| Dominion Rental Holdings Llc | $46,000 | Eagle Premier Title Group Ll | |
| Cox Susan | $125,000 | -- | |
| Dominion Rentals Llc | $40,000 | -- | |
| Bruce Bryan | -- | -- | |
| Bruce Bryan | $86,000 | -- | |
| Sanford Theodore B | -- | -- |
Source: Public Records
Mortgage History
| Date | Status | Borrower | Loan Amount |
|---|---|---|---|
| Previous Owner | Bruce Bryan | $128,350 |
Source: Public Records
Tax History
| Year | Tax Paid | Tax Assessment Tax Assessment Total Assessment is a certain percentage of the fair market value that is determined by local assessors to be the total taxable value of land and additions on the property. | Land | Improvement |
|---|---|---|---|---|
| 2025 | $2,075 | $106,667 | -- | -- |
| 2024 | $2,075 | $88,333 | -- | -- |
| 2023 | $2,349 | $100,000 | $25,000 | $75,000 |
| 2022 | $2,281 | $96,667 | $0 | $0 |
| 2021 | $2,203 | $93,333 | $0 | $0 |
| 2020 | $2,124 | $90,000 | $20,000 | $70,000 |
| 2019 | $2,114 | $90,000 | $20,000 | $70,000 |
| 2018 | $2,124 | $90,000 | $20,000 | $70,000 |
| 2017 | $2,181 | $92,400 | $0 | $0 |
| 2016 | $2,437 | $107,633 | $0 | $0 |
| 2015 | $2,437 | $105,267 | $0 | $0 |
| 2014 | $2,437 | $102,900 | $0 | $0 |
Source: Public Records
Map
Nearby Homes
- 1332 Cambria St
- 1341 Cambria St
- 1351 Cambria St
- 1137 Monroe Cir
- 3614 Saint Margaret St
- 3750 Saint Margaret St
- 3817 Saint Margaret St
- 1510 Sycamore St
- 3816 Saint Margaret St
- 3832 Saint Margaret St
- 3735 Saint Victor St
- 3826 10th St
- 3830 10th St
- 916 Jack St
- 4030 Pennington Ave
- 804 Pontiac Ave
- 3609 Brooklyn Ave
- 1616 Plum St
- 4116 Morrison Ct
- 4115 Morrison Ct
- 1218 Cambria St
- 1214 Cambria St
- 1220 Cambria St
- 1211 E Patapsco Ave
- 1215 E Patapsco Ave
- 1209 E Patapsco Ave
- 1213 E Patapsco Ave
- 1207 E Patapsco Ave
- 1207 E Patapsco Ave
- 1205 E Patapsco Ave
- 1301 E Patapsco Ave
- 1301 Cambria St
- 1303 E Patapsco Ave
- 1303 Cambria St
- 1203 E Patapsco Ave
- 1305 E Patapsco Ave
- 1305 Cambria St
- 1307 Cambria St
- 1307 E Patapsco Ave
- 1309 Cambria St
Your Personal Tour Guide
Ask me questions while you tour the home.