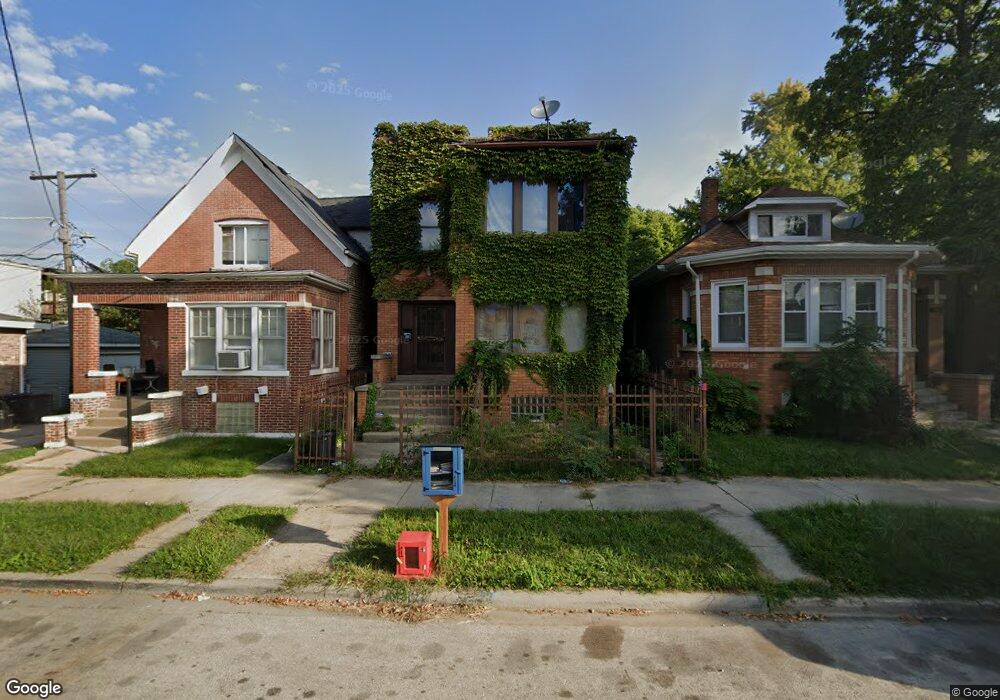
1216 E 71st Place Chicago, IL 60619
Grand Crossing NeighborhoodEstimated Value: $189,538
5
Beds
2
Baths
2,298
Sq Ft
$82/Sq Ft
Est. Value
About This Home
This home is located at 1216 E 71st Place, Chicago, IL 60619 and is currently estimated at $189,538, approximately $82 per square foot. 1216 E 71st Place is a home located in Cook County with nearby schools including Revere Elementary School, Gary Comer College Prep Middle School, and Gary Comer College Prep.
Ownership History
Date
Name
Owned For
Owner Type
Purchase Details
Closed on
May 9, 2022
Sold by
Yarbrough Karen A
Bought by
Cook County Land Bank Authority
Current Estimated Value
Purchase Details
Closed on
Mar 22, 2011
Sold by
Global Real Estate Properties Llc
Bought by
One East Llc Series 2
Purchase Details
Closed on
Aug 19, 2010
Sold by
Mccrimmon Michelle
Bought by
Global Real Estate Properties Llc
Purchase Details
Closed on
Nov 19, 2009
Sold by
Mccrimmon Michelle
Bought by
Jdy Investment Group Ltd
Purchase Details
Closed on
Nov 23, 1998
Sold by
Cooper Dana and Cooper Leigh Bessie
Bought by
Mccrimmon Michelle
Home Financials for this Owner
Home Financials are based on the most recent Mortgage that was taken out on this home.
Original Mortgage
$79,950
Interest Rate
6.8%
Mortgage Type
FHA
Purchase Details
Closed on
Aug 4, 1997
Sold by
Jackson Lula
Bought by
Cooper Dana and Cooper Bessie
Create a Home Valuation Report for This Property
The Home Valuation Report is an in-depth analysis detailing your home's value as well as a comparison with similar homes in the area
Home Values in the Area
Average Home Value in this Area
Purchase History
| Date | Buyer | Sale Price | Title Company |
|---|---|---|---|
| Cook County Land Bank Authority | -- | None Listed On Document | |
| One East Llc Series 2 | -- | None Available | |
| Global Real Estate Properties Llc | $25,500 | None Available | |
| Jdy Investment Group Ltd | -- | None Available | |
| Mccrimmon Michelle | $80,000 | Professional National Title | |
| Cooper Dana | -- | -- |
Source: Public Records
Mortgage History
| Date | Status | Borrower | Loan Amount |
|---|---|---|---|
| Previous Owner | Mccrimmon Michelle | $79,950 |
Source: Public Records
Tax History
| Year | Tax Paid | Tax Assessment Tax Assessment Total Assessment is a certain percentage of the fair market value that is determined by local assessors to be the total taxable value of land and additions on the property. | Land | Improvement |
|---|---|---|---|---|
| 2025 | $2,468 | -- | -- | -- |
| 2024 | $2,468 | -- | -- | -- |
| 2023 | $2,468 | -- | -- | -- |
| 2022 | $2,468 | $12,000 | $3,906 | $8,094 |
| 2021 | $2,413 | $11,999 | $3,906 | $8,093 |
| 2020 | $2,819 | $12,655 | $3,437 | $9,218 |
| 2019 | $2,857 | $14,220 | $3,437 | $10,783 |
| 2018 | $2,809 | $14,220 | $3,437 | $10,783 |
| 2017 | $3,995 | $18,556 | $3,125 | $15,431 |
| 2016 | $3,717 | $18,556 | $3,125 | $15,431 |
| 2015 | $3,400 | $18,556 | $3,125 | $15,431 |
| 2014 | $2,743 | $14,786 | $2,500 | $12,286 |
| 2013 | $2,689 | $14,786 | $2,500 | $12,286 |
Source: Public Records
Map
Nearby Homes
- 1225 E 71st Place
- 7135 S Woodlawn Ave
- 1229 E 71st St
- 7125 S University Ave
- 1301 E 71st Place Unit 2
- 7225 S Woodlawn Ave
- 1310 E 72nd St
- 7146 S University Ave
- 7022 S Kimbark Ave
- 1301 E 73rd St
- 1415 E 71st Place
- 7316 S Woodlawn Ave
- 1336 E 73rd St
- 1401 E 71st Place
- 7326 S Woodlawn Ave
- 7337 S University Ave
- 7335 S Greenwood Ave
- 1446 E 71st Place
- 7124 S Ellis Ave
- 7356 S Kenwood Ave
- 1214 E 71st Place
- 1220 E 71st Place
- 1222 E 71st Place
- 1226 E 71st Place
- 7119 S Woodlawn Ave
- 7119 S Woodlawn Ave Unit 2
- 7123 S Woodlawn Ave Unit 1
- 1230 E 71st Place
- 7117 S Woodlawn Ave
- 7117 S Woodlawn Ave
- 7125 S Woodlawn Ave
- 7125 S Woodlawn Ave Unit 2
- 7125 S Woodlawn Ave
- 1230 E 71st Place
- 7115 S Woodlawn Ave Unit 2
- 1215 E 71st St
- 1215 E 71st Place
- 1211 E 71st Place
- 7111 S Woodlawn Ave Unit I
- 1225 E 71st St
Your Personal Tour Guide
Ask me questions while you tour the home.